# Load data
data(upworthy_question, package = "hecbayes")
# Compute sufficient statistics
data <- upworthy_question |>
  dplyr::group_by(question) |>
  dplyr::summarize(ntot = sum(impressions),
                   y = sum(clicks))
# Create containers for MCMC
niter <- 1e4L
chain <- matrix(0, nrow = niter, ncol = 2L)
colnames(chain) <- c("beta","kappa")Bayesian modelling
Markov chain Monte Carlo: Gibbs sampling
Léo Belzile
Last compiled Wednesday Sep 16, 2026
Markov chain Monte Carlo
We consider simulating from a distribution with associated density function proportional to \(p(\cdot)\)
- using an algorithm that generates a Markov chain ,
- without requiring knowledge of the normalizing factor.
We use a conditional density \(q(\boldsymbol{\theta} \mid \boldsymbol{\theta}^{\text{cur}})\) to generate proposals from the current value \(\boldsymbol{\theta}^{\text{cur}}.\)
Metropolis–Hastings algorithm
Starting from an initial value \(\boldsymbol{\theta}_0\): for \(t=1, \ldots, T\)
- draw a proposal value \(\boldsymbol{\theta}_t^{\star} \sim q(\boldsymbol{\theta} \mid \boldsymbol{\theta}_{t-1})\).
- Compute the acceptance ratio \[ R = \frac{p(\boldsymbol{\theta}_t^{\star})}{p(\boldsymbol{\theta}_{t-1})}\frac{q(\boldsymbol{\theta}_{t-1} \mid \boldsymbol{\theta}_t^{\star} )}{q(\boldsymbol{\theta}_t^{\star} \mid \boldsymbol{\theta}_{t-1})} \]
- With probability \(\alpha=\min\{R, 1\}\), accept the proposal and set \(\boldsymbol{\theta}_t \gets \boldsymbol{\theta}_t^{\star}\), otherwise set the value to the previous state, \(\boldsymbol{\theta}_t \gets \boldsymbol{\theta}_{t-1}\).
Theory
The Metropolis–Hastings algorithm satisfies a technical condition (detailed balance) that ensures that the Markov chain generated is reversible.
- Thus, any draw from the posterior will generate a new realization from the posterior.
- Provided the starting value has non-zero probability under the posterior, the chain will converge to the stationarity distribution (albeit perhaps slowly).
Interpretation
- If \(R>1\), the proposal has higher density and we always accept the move.
- If we reject the move, the Markov chain stays at the current value, which induces autocorrelation.
- Since the acceptance probability depends only on the density through ratios, normalizing factors of \(p\) and \(q\) cancel out.
Symmetric proposals and random walk
If the proposal is symmetric, the ratio of proposal densities is \[q(\boldsymbol{\theta}_{t-1} \mid \boldsymbol{\theta}_t^{\star} ) / q(\boldsymbol{\theta}_t^{\star} \mid \boldsymbol{\theta}_{t-1}) = 1.\]
Common examples include random walk proposals \[\boldsymbol{\theta}_t^{\star} \gets \boldsymbol{\theta}_{t-1} + \tau Z,\] where \(Z \sim \mathsf{Gauss}(0,1).\)
Independent proposals
If we pick instead a global proposal, we must ensure that \(q\) samples in far regions (recall rejection sampling), otherwise …
Good proposals include heavy tailed distribution such as Student-\(t\) with small degrees of freedom,
centered at the maximum a posteriori \(\widehat{\boldsymbol{\theta}}\) and
with scale matrix proportional to \(-\mathbf{H}^{-1}(\boldsymbol{\theta}_t^{\star})\), where \(\mathbf{H}(\cdot)\) is the Hessian of the (unnormalized) log posterior.
Upworthy data example
We model the Poisson rates for headlines with questions or not. Our model is \[\begin{align*} Y_{i} &\sim \mathsf{Poisson}(n_i\lambda_i), \qquad (i=1,2)\\ \lambda_1 &= \exp(\beta + \kappa) \\ \lambda_2 &= \exp(\beta) \\ \beta & \sim \mathsf{Gauss}(\log 0.01, 1.5) \\ \kappa &\sim \mathsf{Gauss}(0, 1) \end{align*}\]
Implementation details: data and containers
In regression models, scale inputs if possible.
Implementation details: log posterior function
Perform all calculations on the log scale to avoid numerical overflow!
# Code log posterior as sum of log likelihood and log prior
loglik <- function(par, counts = data$y, offset = data$ntot, ...){
  lambda <- exp(c(par[1] + log(offset[1]), par[1] + par[2] + log(offset[2])))
 sum(dpois(x = counts, lambda = lambda, log = TRUE))
}
# Note common signature of function
logprior <- function(par, ...){
  dnorm(x = par[1], mean = log(0.01), sd = 1.5, log = TRUE) +
    dnorm(x = par[2], log = TRUE)
}
logpost <- function(par, ...){
  loglik(par, ...) + logprior(par, ...)
}
Implementation details: proposals
Use good starting values for your Markov chains, such as maximum a posteriori.
# Compute maximum a posteriori (MAP)
map <- optim(
  par = c(-4, 0.07),
  fn = logpost,
  control = list(fnscale = -1),
  offset = data$ntot,
  counts = data$y,
  hessian = TRUE)
# Use MAP as starting value
cur <- map$par
# Compute logpost_cur - we can keep track of this to reduce calculations
logpost_cur <- logpost(cur)
# Proposal covariance
cov_map <- -2*solve(map$hessian)
chol <- chol(cov_map)
Implementation details: Metropolis–Hastings algorithm
Use seed for reproducibility, do not compute posterior twice, compute log of acceptance ratio.
set.seed(80601)
naccept <- 0L
for(i in seq_len(niter)){
  # Multivariate normal proposal - symmetric random walk
  prop <- c(rnorm(n = 2) %*% chol + cur)
  logpost_prop <- logpost(prop)
  logR <- logpost_prop - logpost_cur
  if(logR > -rexp(1)){
    cur <- prop
    logpost_cur <- logpost_prop
    naccept <- naccept + 1L
  }
  chain[i,] <- cur
}
Implementation details: analysis of output
1. Empirical mean and standard deviation for each variable,
   plus standard error of the mean:

          Mean       SD  Naive SE Time-series SE
beta  -4.51268 0.001697 1.697e-05      6.176e-05
kappa  0.07075 0.002033 2.033e-05      9.741e-05

2. Quantiles for each variable:

          2.5%      25%      50%      75%    97.5%
beta  -4.51591 -4.51385 -4.51273 -4.51154 -4.50929
kappa  0.06673  0.06933  0.07077  0.07212  0.07463
Reminder: Metropolis–Hastings algorithm
Starting from an initial value \(\boldsymbol{\theta}_0\):
- draw a proposal value \(\boldsymbol{\theta}_t^{\star} \sim q(\boldsymbol{\theta} \mid \boldsymbol{\theta}_{t-1})\).
- Compute the acceptance ratio \[ R = \frac{p(\boldsymbol{\theta}_t^{\star})}{p(\boldsymbol{\theta}_{t-1})}\frac{q(\boldsymbol{\theta}_{t-1} \mid \boldsymbol{\theta}_t^{\star} )}{q(\boldsymbol{\theta}_t^{\star} \mid \boldsymbol{\theta}_{t-1})} \]
- With probability \(\min\{R, 1\}\), accept the proposal and set \(\boldsymbol{\theta}_t \gets \boldsymbol{\theta}_t^{\star}\), otherwise set the value to the previous state, \(\boldsymbol{\theta}_t \gets \boldsymbol{\theta}_{t-1}\).
Calculations
We compute the log of the acceptance ratio, \(\ln R\), to avoid numerical overflow, with the log posterior difference \[ \ln \left\{\frac{p(\boldsymbol{\theta}_t^{\star})}{p(\boldsymbol{\theta}_{t-1})}\right\} = \ell(\boldsymbol{\theta}_t^{\star}) + \ln p(\boldsymbol{\theta}_t^{\star}) - \ell(\boldsymbol{\theta}_{t-1}) - \ln p(\boldsymbol{\theta}_{t-1}) \]
Compare the value of \(\ln R\) (if less than zero) to \(\log(U)\), where \(U \sim \mathsf{unif}(0,1)\).
What proposal?
The independence Metropolis–Hastings uses a global proposal \(q\) which does not depend on the current state (typically centered at the MAP)
This may be problematic with multimodal targets.
The Gaussian random walk takes \(\boldsymbol{\theta}_t^{\star} =\boldsymbol{\theta}_{t-1}+ \sigma_\text{p}Z\), where \(Z \sim \mathsf{Gauss}(0,1)\) and \(\sigma_\text{p}\) is the proposal standard deviation. Random walks allow us to explore the space.
Burn in
We are guaranteed to reach stationarity with Metropolis–Hastings, but it may take a large number of iterations…
One should discard initial draws during a burn in or warmup period if the chain has not reached stationarity. Ideally, use good starting value to reduce waste.
We can also use the warmup period to adapt the variance of the proposal.
Goldilock principle and proposal variance
Mixing of the chain requires just the right variance (not too small nor too large).
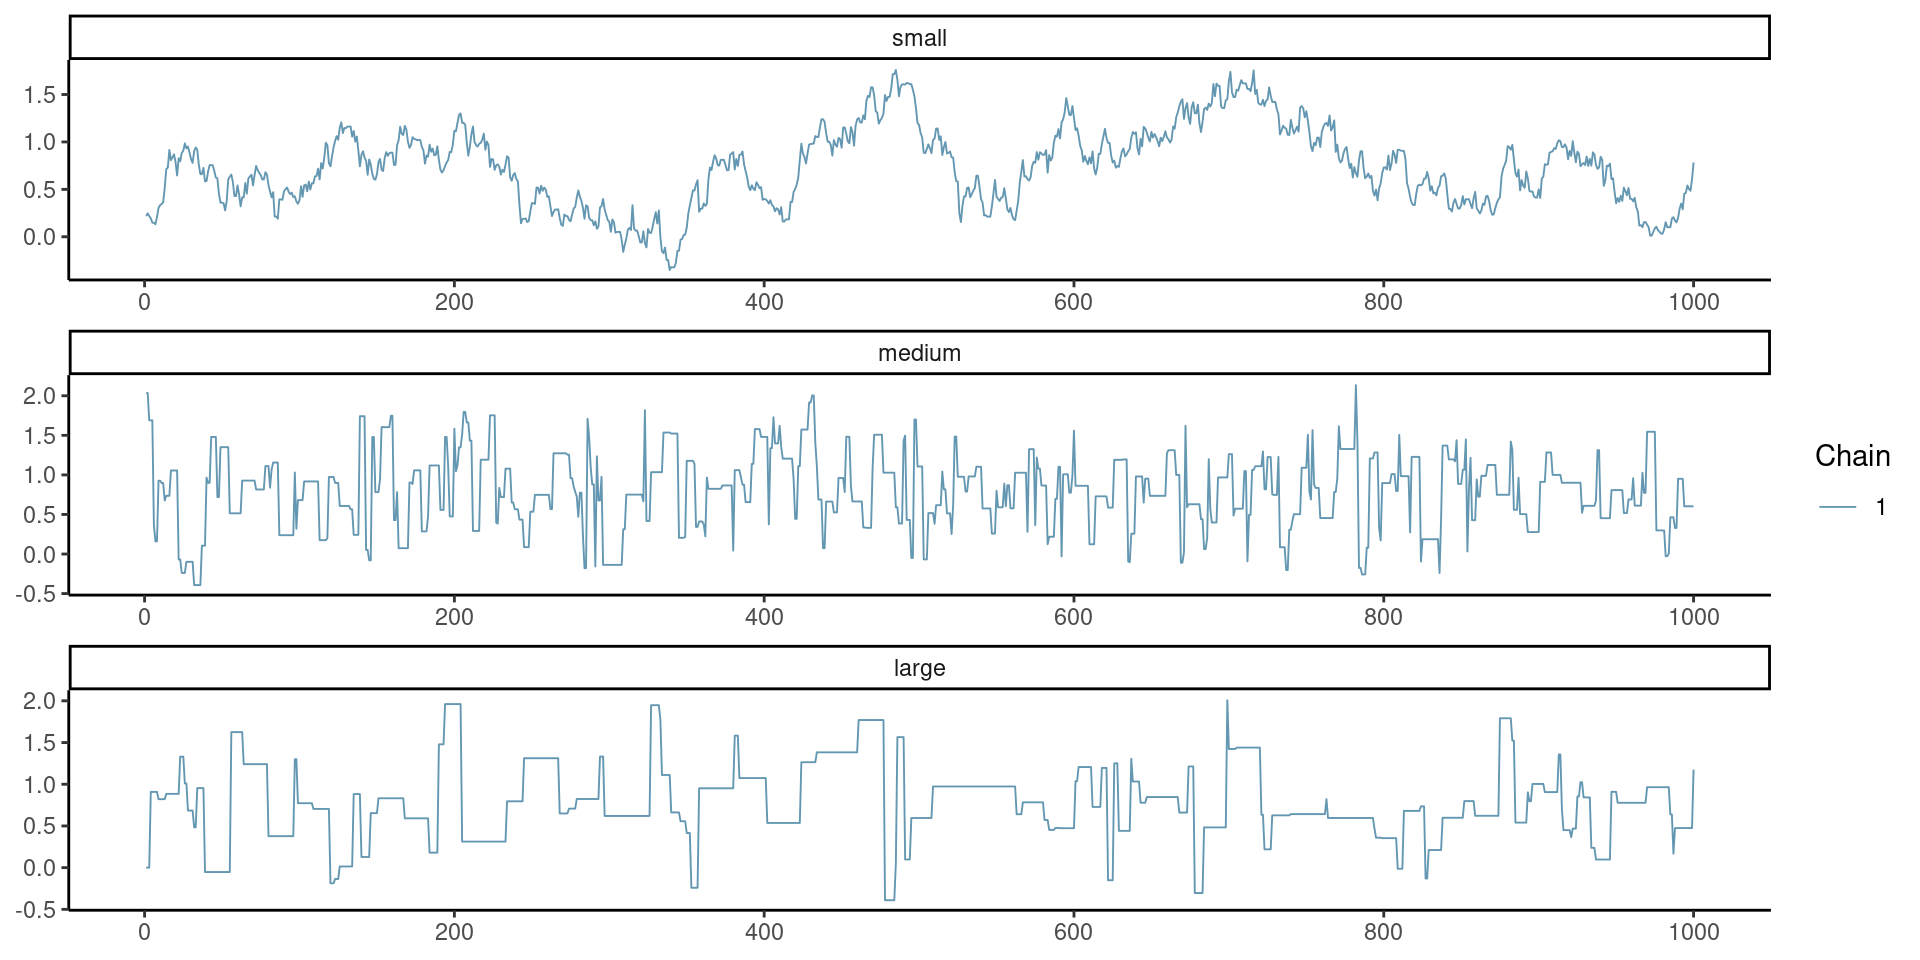
Figure 1: Example of traceplot with proposal variance that is too small (top), adequate (middle) and too large (bottom).
Correlograms for Goldilock
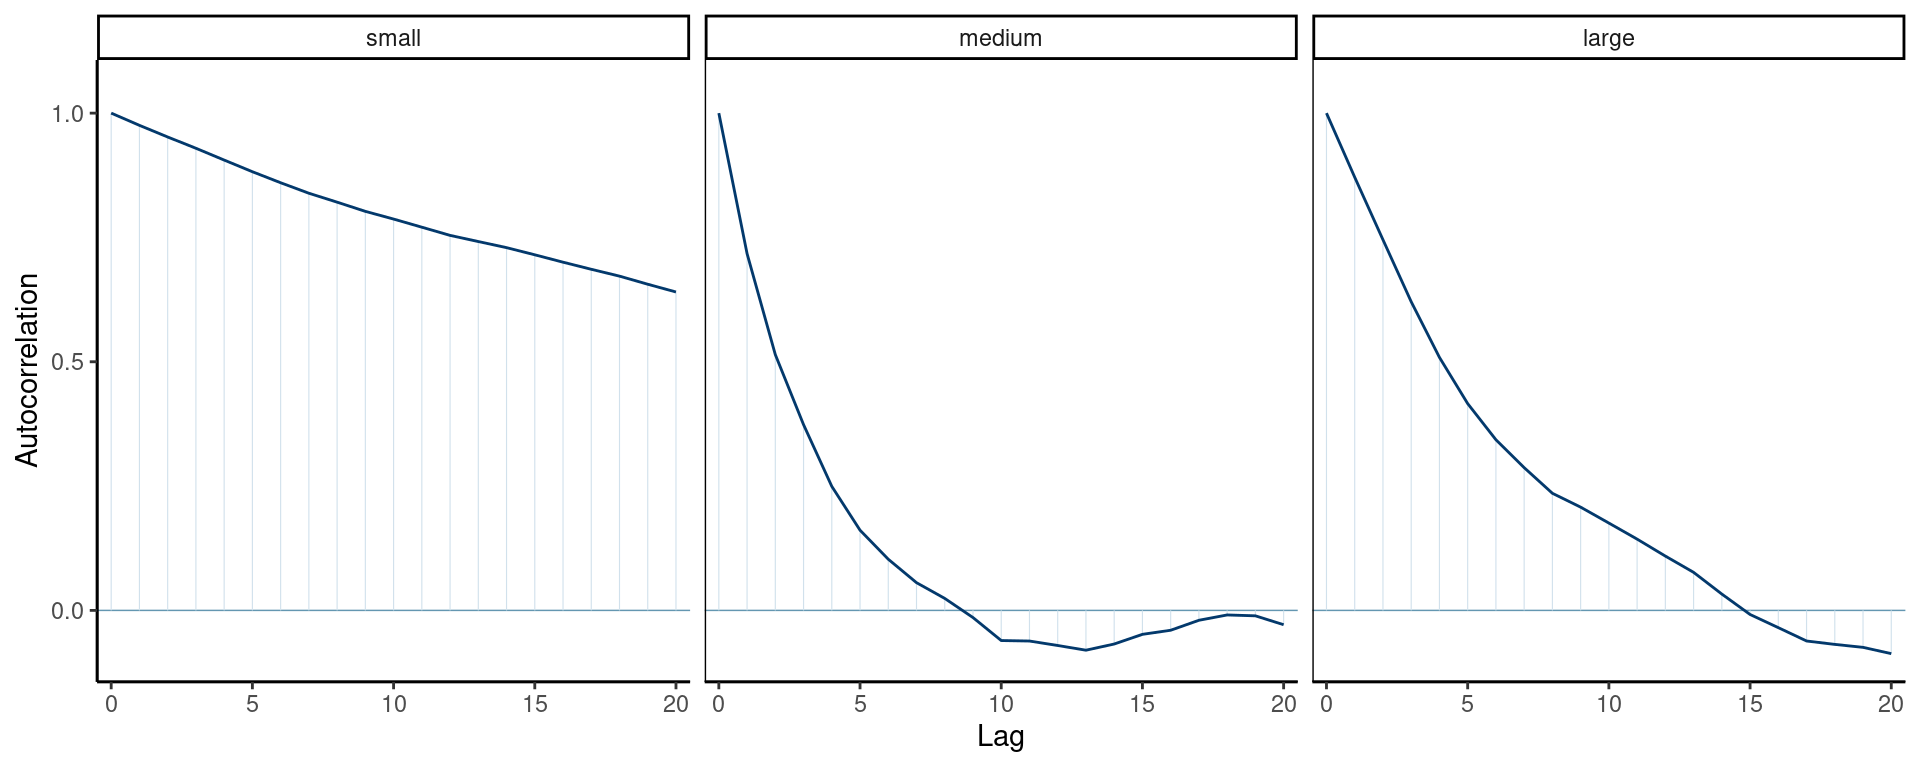
Figure 2: Correlogram for the three Markov chains.
Tuning Markov chain Monte Carlo
- Outside of starting values, the variance of the proposal has a huge impact on the asymptotic variance.
- We can adapt the variance during warmup by increasing/decreasing proposal variance (if acceptance rate is too large/small).
- We can check this via the acceptance rate (how many proposals are accepted).
Optimal acceptance rates
The following rules were derived for Gaussian targets under idealized situations.
- In 1D, rule of thumb is an acceptance rate of \(0.44\) is optimal, and this ratio decreases to \(0.234\) when \(D \geq 2\) (Sherlock, 2013) for random walk Metropolis–Hastings.
- Proposals for \(D\)-variate update should have proposal variance of roughly \((2.38^2/d)\times \boldsymbol{\Sigma}\), where \(\boldsymbol{\Sigma}\) is the posterior variance.
- For MALA (see later), we get \(0.574\) rather than \(0.234\)
Block update or one parameter at a time?
As with any accept-reject, proposals become inefficient when the dimension \(D\) increase.
This is the curse of dimensionality.
Updating parameters in turn
- increases acceptance rate (with clever proposals),
- but also leads to more autocorrelation between parameters
Solutions for strongly correlated coefficients
- Reparametrize the model to decorrelate variables (orthogonal parametrization).
- Block updates: draw correlated parameters together
- using the chain history to learn the correlation, if necessary
Parameter transformation
Parameters may be bounded, e.g. \(\theta_i \in [a,b]\).
- We can ignore this and simply discard proposals outside of the range, by setting the log posterior at \(-\infty\) outside \([a,b]\)
- We can do a transformation, e.g., \(\log \theta_i\) if \(\theta_i > 0\) and perform a random walk on the unconstrained space: don’t forget Jacobians for \(q(\cdot)\)!
- Another alternative is to use truncated proposals (useful with more complex algorithms like MALA)
Efficient proposals: MALA
The Metropolis-adjusted Langevin algorithm (MALA) uses a Gaussian random walk proposal \[\boldsymbol{\theta}^{\star}_t \sim \mathsf{Gauss}\{\mu(\boldsymbol{\theta}_{t-1}), \tau^2\mathbf{A}\},\] with mean \[\mu(\boldsymbol{\theta}_{t-1})=\boldsymbol{\theta}_{t-1} + \mathbf{A}\eta \nabla \log p(\boldsymbol{\theta}_{t-1} \mid \boldsymbol{y}),\] and variance \(\tau^2\mathbf{A}\), for some mass matrix \(\mathbf{A}\), tuning parameter \(\tau>0\).
The parameter \(\eta < 1\) is a learning rate. This is akin to a Newton algorithm, so beware if you are far from the mode (where the gradient is typically large)!
Higher order proposals
For a single parameter update \(\theta\), a Taylor series expansion of the log posterior around the current value suggests using as proposal density a Gaussian approximation with (Rue & Held, 2005)
- mean \(\mu_{t-1} = \theta_{t-1} - f'(\theta_{t-1})/f''(\theta_{t-1})\) and
- precision \(\tau^{-2} = -f''(\theta_{t-1})\)
We need \(f''(\theta_{t-1})\) to be negative!
This gives local adaption relative to MALA (global variance).
Higher order and moves
For MALA and cie., we need to compute the density of the proposal also for the reverse move for the expansion starting from the proposal \(\mu(\boldsymbol{\theta}_{t}^\star)\).
These methods are more efficient than random walk Metropolis–Hastings, but they require the gradient and the hessian (can be obtained analytically using autodiff, or numerically).
Modelling individual headlines of Upworthy example
The number of conversions nclick is binomial with sample size \(n_i=\)nimpression.
Since \(n_i\) is large, the sample average nclick/nimpression is approximately Gaussian, so write
\[\begin{align*} Y_i &\sim \mathsf{Gauss}(\mu, \sigma^2/n_i)\\ \mu &\sim \mathsf{trunc. Gauss}(0.01, 0.1^2, 0, 1) \\ \sigma &\sim \mathsf{expo}(0.7) \end{align*}\]
MALA: data set-up
MALA: define functions
# Create functions with the same signature (...) for the algorithm
logpost <- function(par, data, ...){
  mu <- par[1]; sigma <- par[2]
  no <- data$no
  y <- data$y
  if(isTRUE(any(sigma <= 0, mu < 0, mu > 1))){
    return(-Inf)
  }
  dnorm(x = mu, mean = 0.01, sd = 0.1, log = TRUE) +
  dexp(sigma, rate = 0.7, log = TRUE) +
  sum(dnorm(x = y, mean = mu, sd = sigma/sqrt(no), log = TRUE))
}
MALA: compute gradient of log posterior
MALA: compute maximum a posteriori
MALA: starting values and mass matrix
MALA: containers and setup
# Create containers for MCMC
B <- 1e4L # number of iterations
warmup <- 1e3L # adaptation period
npar <- 2L
prop_sd <- rep(1, npar) # tuning parameter
chains <- matrix(nrow = B, ncol = npar)
damping <- 0.8
acceptance <- attempts <- 0
colnames(chains) <- names(curr) <- c("mu","sigma")
# Proposal variance proportional to inverse hessian at MAP
prop_var <- diag(prop_sd) %*% Amat %*% diag(prop_sd)
MALA: sample proposal with Newton step
for(i in seq_len(B + warmup)){
  ind <- pmax(1, i - warmup)
  # Compute the proposal mean for the Newton step
  prop_mean <- c(curr + damping *
     Amat %*% logpost_grad(curr, data = qdata))
  # prop <- prop_sd * c(rnorm(npar) %*% cholA) + prop_mean
  prop <- c(mvtnorm::rmvnorm(
    n = 1,
    mean = prop_mean,
    sigma = prop_var))
#  [...]
MALA: reverse step
  # Compute the reverse step
  curr_mean <- c(prop + damping *
     Amat %*% logpost_grad(prop, data = qdata))
  # log of ratio of bivariate Gaussian densities
  logmh <- mvtnorm::dmvnorm(
    x = curr, mean = prop_mean,
    sigma = prop_var,
    log = TRUE) -
    mvtnorm::dmvnorm(
      x = prop,
      mean = curr_mean,
      sigma = prop_var,
      log = TRUE) +
  logpost(prop, data = qdata) -
    logpost(curr, data = qdata)
MALA: Metropolis–Hastings ratio
MALA: adaptation
  if(i %% 100 & i < warmup){
    # Check acceptance rate and increase/decrease variance
    out <- hecbayes::adaptive(
      attempts = attempts, # counter for number of attempts
      acceptance = acceptance,
      sd.p = prop_sd, #current proposal standard deviation
      target = 0.574) # target acceptance rate
    prop_sd <- out$sd # overwrite current std.dev
    acceptance <- out$acc # if we change std. dev, this is set to zero
    attempts <- out$att # idem, otherwise unchanged
    prop_var <- diag(prop_sd) %*% Amat %*% diag(prop_sd)
  }
} # End of MCMC for loop
Gibbs sampling
The Gibbs sampling algorithm builds a Markov chain by iterating through a sequence of conditional distributions.
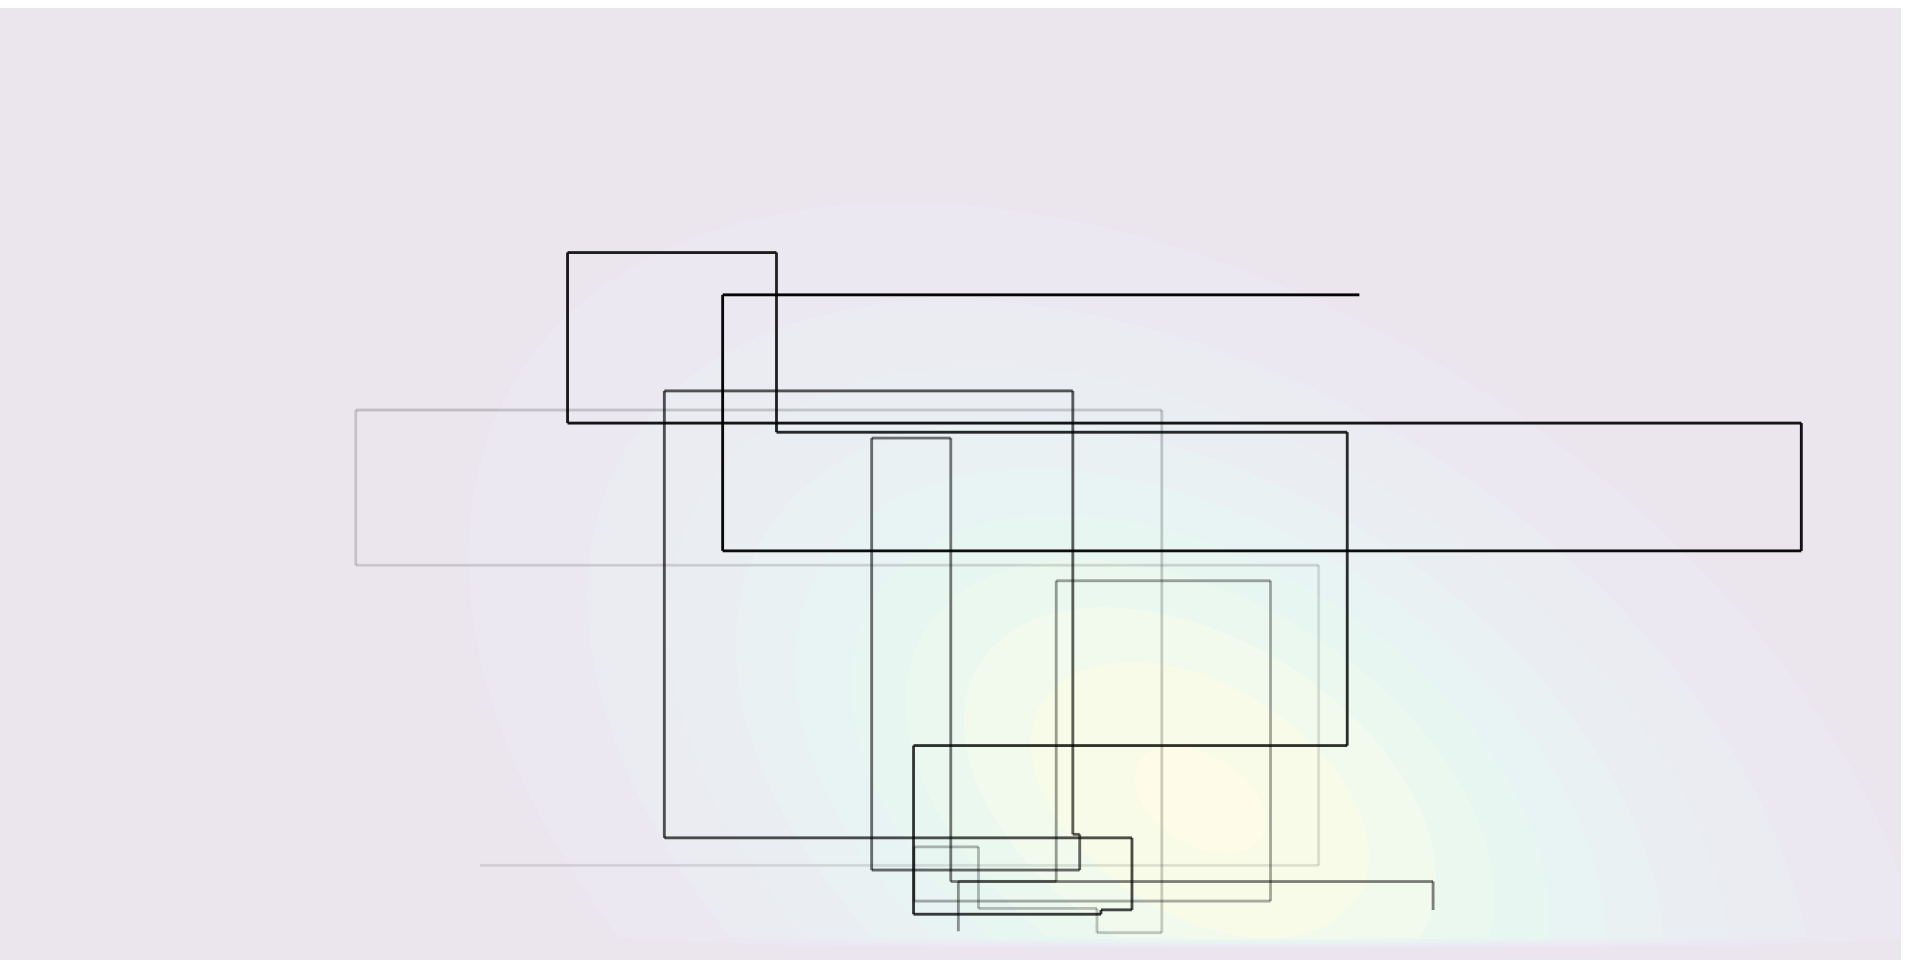
Figure 3: Sampling trajectory for a bivariate target using Gibbs sampling.
Gibbs sampler
Split the parameter vector \(\boldsymbol{\theta} \in \boldsymbol{\Theta} \subseteq \mathbb{R}^p\) into \(m \leq p\) blocks, \[\boldsymbol{\theta}^{[j]}\quad j=1, \ldots, m\] such that, conditional on the remaining components of the parameter vector \(\boldsymbol{\theta}^{-[j]}\), the conditional posterior \[p(\boldsymbol{\theta}^{[j]} \mid \boldsymbol{\theta}^{-[j]}, \boldsymbol{y})\] is from a known distribution from which we can easily simulate.
Gibbs sampling update
At iteration \(t\), we can update each block in turn: note that the \(k\)th block uses the partially updated state \[\begin{align*} \boldsymbol{\theta}^{-[k]\star} = (\boldsymbol{\theta}_{t}^{[1]}, \ldots, \boldsymbol{\theta}_{t}^{[k-1]},\boldsymbol{\theta}_{t-1}^{[k+1]}, \boldsymbol{\theta}_{t-1}^{[m]}) \end{align*}\] which corresponds to the current value of the parameter vector after the updates.
Notes on Gibbs sampling
- Special case of Metropolis–Hastings with conditional density as proposal \(q\).
- The benefit is that all proposals get accepted, \(R=1\)!
- No tuning parameter, but parametrization matters.
- Automatic acceptance does not equal efficiency.
To check the validity of the Gibbs sampler, see the methods proposed in Geweke (2004).
Efficiency of Gibbs sampling
As the dimension of the parameter space increases, and as the correlation between components becomes larger, the efficiency of the Gibbs sampler degrades
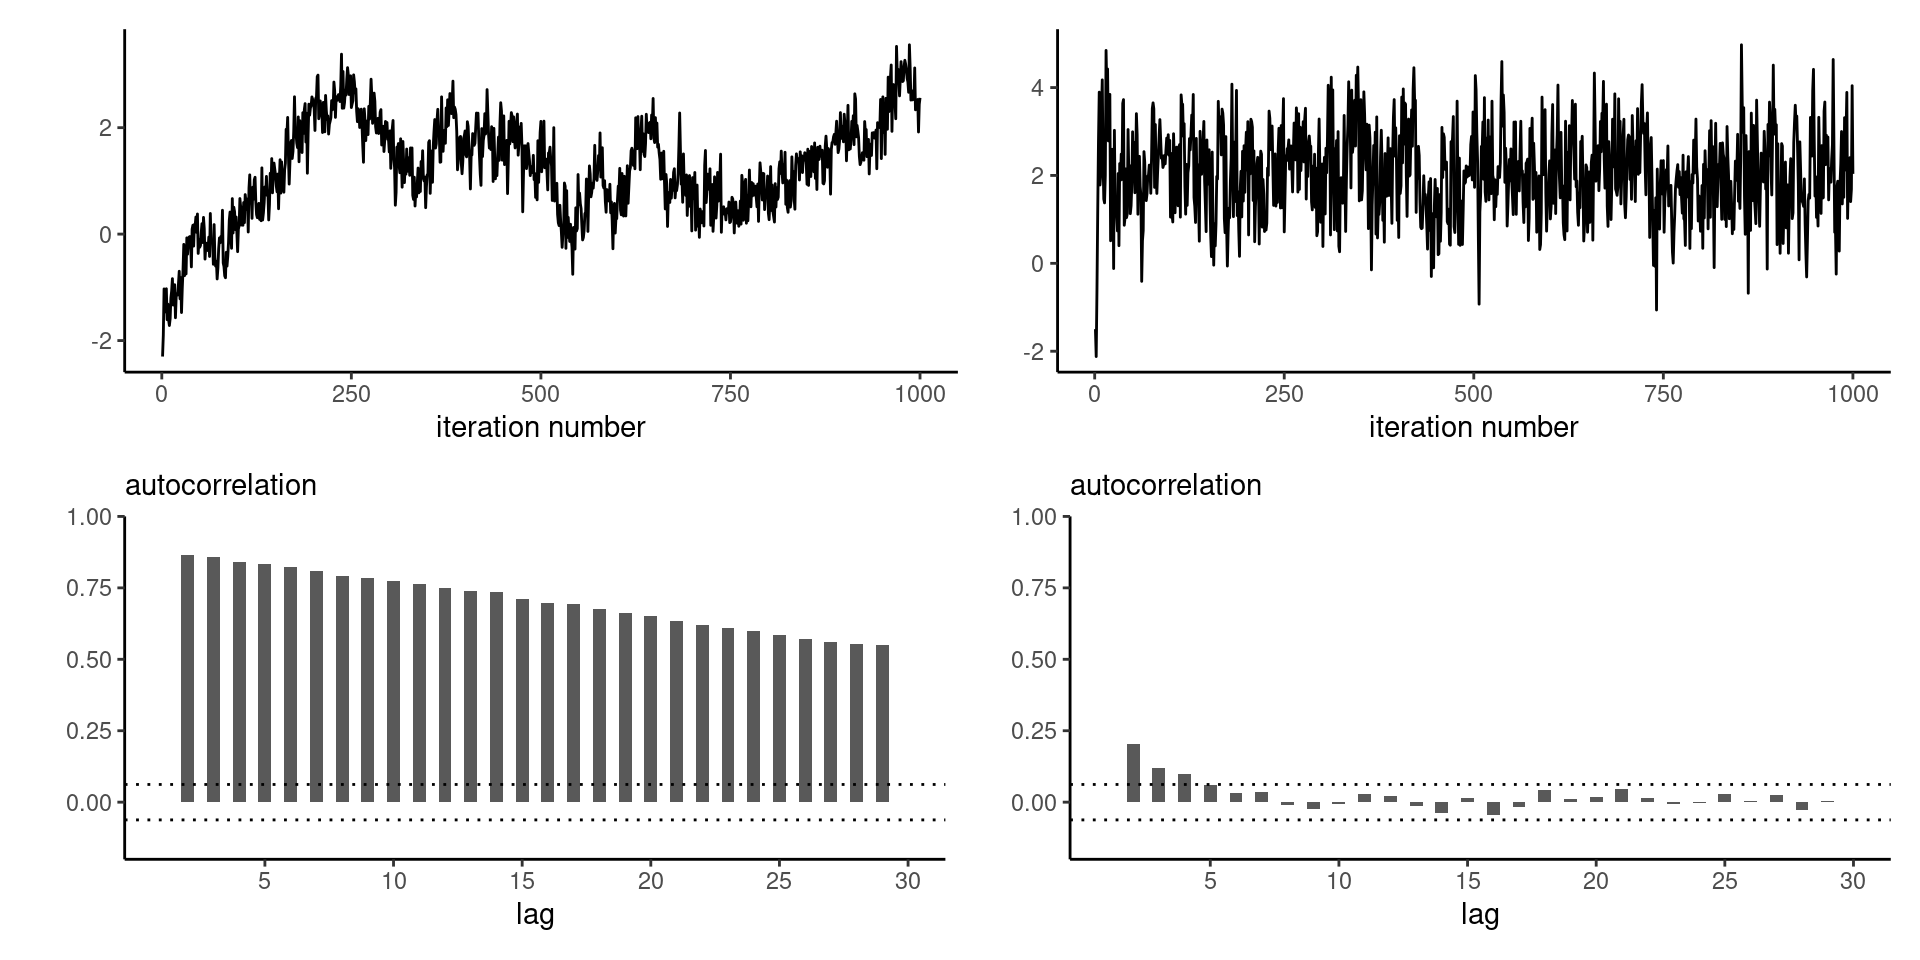
Figure 4: Trace plots (top) and correlograms (bottom) for the first component of a Gibbs sampler with \(d=20\) equicorrelated Gaussian variates with correlation \(\rho=0.9\) (left) and \(d=3\) with equicorrelation \(\rho=0.5\) (right).
Gibbs sampling requires work!
- You need to determine all of the relevant conditional distributions, which often relies on setting conditionally conjugate priors.
- In large models with multiple layers, full conditionals may only depend on a handful of parameters (via directed acyclic graph and moral graph of the model; not covered).
Example of Gibbs sampling
Consider independent and identically distributed observations, with \[\begin{align*} Y_i &\sim \mathsf{Gauss}(\mu, \tau), \qquad i=1, \ldots, n) \\\mu &\sim \mathsf{Gauss}(\nu, \omega)\\ \tau &\sim \mathsf{inv. gamma}(\alpha, \beta) \end{align*}\]
The joint posterior is not available in closed form, but the independent priors for the mean and variance of the observations are conditionally conjugate.
Joint posterior for Gibbs sample
Write the posterior density as usual, \[\begin{align*} &p(\mu, \tau \mid \boldsymbol{y}) \propto \tau^{-\alpha-1}\exp(-\beta/\tau)\\ &\quad \times \tau^{-n/2}\exp\left\{-\frac{1}{2\tau}\left(\sum_{i=1}^n y_i^2 - 2\mu \sum_{i=1}^n y_i+n\mu^2 \right)\right\}\\&\quad \times \exp\left\{-\frac{(\mu-\nu)^2}{2\omega}\right\} \end{align*}\]
Recognizing distributions from posterior
Consider the conditional densities of each parameter in turn (up to proportionality): \[\begin{align*} p(\mu \mid \tau, \boldsymbol{y}) &\propto \exp\left\{-\frac{1}{2} \left( \frac{\mu^2-2\mu\overline{y}}{\tau/n} + \frac{\mu^2-2\nu \mu}{\omega}\right)\right\}\\ p(\tau \mid \mu, \boldsymbol{y}) & \propto \tau^{-n/2-\alpha-1}\exp\left[-\frac{\left\{\frac{\sum_{i=1}^n (y_i-\mu)^2}{2} + \beta \right\}}{\tau}\right] \end{align*}\]
Gibs sample
We can simulate in turn \[\begin{align*} \mu_t \mid \tau_{t-1}, \boldsymbol{y} &\sim \mathsf{Gauss}\left(\frac{n\overline{y}\omega+\tau \nu}{\tau + n\omega}, \frac{\omega \tau}{\tau + n\omega}\right)\\ \tau_t \mid \mu_t, \boldsymbol{y} &\sim \mathsf{inv. gamma}\left\{\frac{n}{2}+\alpha, \frac{\sum_{i=1}^n (y_i-\mu)^2}{2} + \beta\right\}. \end{align*}\]
Data augmentation and auxiliary variables
When the likelihood \(p(\boldsymbol{y}; \boldsymbol{\theta})\) is intractable or costly to evaluate (e.g., mixtures, missing data, censoring), auxiliary variables are introduced to simplify calculations.
Consider auxiliary variables \(\boldsymbol{U} \in \mathbb{R}^k\) such that \[\int_{\mathbb{R}^k} p(\boldsymbol{U}, \boldsymbol{\theta}\mid \boldsymbol{y}) \mathrm{d} \boldsymbol{U} = p(\boldsymbol{\theta}\mid \boldsymbol{y}),\] i.e., the marginal distribution is that of interest, but evaluation of \(p(\boldsymbol{U}, \boldsymbol{\theta}; \boldsymbol{y})\) is cheaper.
Bayesian augmentation
The data augmentation algorithm (Tanner & Wong, 1987) consists in running a Markov chain on the augmented state space \((\Theta, \mathbb{R}^k)\), simulating in turn from the conditionals
- \(p(\boldsymbol{U}\mid \boldsymbol{\theta}, \boldsymbol{y})\) and
- \(p(\boldsymbol{\theta}\mid \boldsymbol{U}, \boldsymbol{y})\)
For more details and examples, see Dyk & Meng (2001) and Hobert (2011).
Data augmentation: probit example
Consider independent binary responses \(\boldsymbol{Y}_i\), with \[\begin{align*} p_i = \Pr(Y_i=1) = \Phi(\beta_0 + \beta_1 \mathrm{X}_{i1} + \cdots + \beta_p\mathrm{X}_{ip}), \end{align*}\] where \(\Phi\) is the distribution function of the standard Gaussian distribution. The likelihood of the probit model is \[L(\boldsymbol{\beta}; \boldsymbol{y}) = \prod_{i=1}^n p_i^{y_i}(1-p_i)^{1-y_i},\] and this prevents easy simulation.
Probit augmentation
We can consider a data augmentation scheme where \(Y_i = \mathrm{I}(Z_i > 0)\), where \(Z_i \sim \mathsf{Gauss}(\mathbf{x}_i\boldsymbol{\beta}, 1)\), where \(\mathbf{x}_i\) is the \(i\)th row of the design matrix.
The augmented data likelihood is \[\begin{align*} p(\boldsymbol{z}, \boldsymbol{y} \mid \boldsymbol{\beta}) &\propto \exp\left\{-\frac{1}{2}(\boldsymbol{z} - \mathbf{X}\boldsymbol{\beta})^\top(\boldsymbol{z} - \mathbf{X}\boldsymbol{\beta})\right\} \\&\quad \times \prod_{i=1}^n \mathrm{I}(z_i > 0)^{y_i}\mathrm{I}(z_i \le 0)^{1-y_i} \end{align*}\]
Conditional distributions for probit regression
\[\begin{align*} \boldsymbol{\beta} \mid \boldsymbol{z}, \boldsymbol{y} &\sim \mathsf{Gauss}\left\{\widehat{\boldsymbol{\beta}}, (\mathbf{X}^\top\mathbf{X})^{-1}\right\}\\ Z_i \mid y_i, \boldsymbol{\beta} &\sim \begin{cases} \mathsf{trunc. Gauss}(\mathbf{x}_i\boldsymbol{\beta}, -\infty, 0) & y_i =0 \\ \mathsf{trunc. Gauss}(\mathbf{x}_i\boldsymbol{\beta}, 0, \infty) & y_i =1. \end{cases} \end{align*}\] with \(\widehat{\boldsymbol{\beta}}=(\mathbf{X}^\top\mathbf{X})^{-1}\mathbf{X}^\top\boldsymbol{z}\) the ordinary least square estimator.
Data augmentation with scale mixture of Gaussian
The Laplace distribution with mean \(\mu\) and scale \(\sigma\) has density \[\begin{align*} f(x; \mu, \sigma) = \frac{1}{2\sigma}\exp\left(-\frac{|x-\mu|}{\sigma}\right), \end{align*}\] and can be expressed as a scale mixture of Gaussians, where \(Y \mid \tau \sim \mathsf{Laplace}(\mu, \tau)\) is equivalent to \(Z \mid \tau \sim \mathsf{Gauss}(\mu, \tau)\) and \(\tau \sim \mathsf{expo}\{(2\sigma)^{-1}\}\).
Joint posterior for Laplace model
With \(p(\mu, \sigma) \propto \sigma^{-1}\), the joint posterior for the i.i.d. sample is \[\begin{align*} p(\boldsymbol{\tau}, \mu, \sigma \mid \boldsymbol{y}) &\propto \left(\prod_{i=1}^n \tau_i\right)^{-1/2}\exp\left\{-\frac{1}{2}\sum_{i=1}^n \frac{(y_i-\mu)^2}{\tau_i}\right\} \\&\quad \times \frac{1}{\sigma^{n+1}}\exp\left(-\frac{1}{2\sigma}\sum_{i=1}^n \tau_i\right) \end{align*}\]
Conditional distributions
The conditionals for \(\mu \mid \cdots\) and \(\sigma \mid \cdots\) are, as usual, Gaussian and inverse gamma, respectively. The variances, \(\tau_j\), are conditionally independent of one another, with \[\begin{align*} p(\tau_j \mid \mu, \sigma, y_j) &\propto \tau_j^{-1/2}\exp\left\{-\frac{1}{2}\frac{(y_j-\mu)^2}{\tau_j} -\frac{1}{2} \frac{\tau_j}{\sigma}\right\} \end{align*}\]
Inverse transformation
With the change of variable \(\xi_j=1/\tau_j\), we have \[\begin{align*} p(\xi_j \mid \mu, \sigma, y_j) &\propto \xi_j^{-3/2}\exp\left\{-\frac{1}{2\sigma}\frac{\xi_j(y_j-\mu)^2}{\sigma} -\frac{1}{2} \frac{1}{\xi_j}\right\}\\ \end{align*}\] and we recognize the Wald (or inverse Gaussian) density, where \(\xi_i \sim \mathsf{Wald}(\nu_i, \lambda)\) with \(\nu_i=\{\sigma/(y_i-\mu)^2\}^{1/2}\) and \(\lambda=\sigma^{-1}\).
Bayesian LASSO
Park & Casella (2008) use this hierarchical construction to defined the Bayesian LASSO. With a model matrix \(\mathbf{X}\) whose columns are standardized to have mean zero and unit standard deviation, we may write \[\begin{align*} \boldsymbol{Y} \mid \mu, \boldsymbol{\beta}, \sigma^2 &\sim \mathsf{Gauss}_n(\mu \boldsymbol{1}_n + \mathbf{X}\boldsymbol{\beta}, \sigma \mathbf{I}_n)\\ \beta_j \mid \sigma, \tau &\sim \mathsf{Gauss}(0, \sigma\tau)\\ \tau &\sim \mathsf{expo}(\lambda/2) \end{align*}\]
Summary
- Gibbs sampling is a special case of Metropolis–Hastings algorithm that leads to acceptance
- We need to get the conditional distribution
References
Dyk, D. A. van, & Meng, X.-L. (2001). The art of data augmentation. Journal of Computational and Graphical Statistics, 10(1), 1–50. https://doi.org/10.1198/10618600152418584
Geweke, J. (2004). Getting it right: Joint distribution tests of posterior simulators. Journal of the American Statistical Association, 99(467), 799–804. https://doi.org/10.1198/016214504000001132
Hobert, J. (2011). The data augmentation algorithm: Theory and methodology. In S. Brooks, A. Gelman, G. Jones, & X. L. Meng (Eds.), Handbook of Markov chain Monte Carlo (pp. 253–293). CRC Press. https://doi.org/10.1201/b10905-11
Park, T., & Casella, G. (2008). The Bayesian Lasso. Journal of the American Statistical Association, 103(482), 681–686. https://doi.org/10.1198/016214508000000337
Rue, H., & Held, L. (2005). Gaussian Markov random fields: Theory and applications (p. 280). CRC Press.
Sherlock, C. (2013). Optimal scaling of the random walk Metropolis: General criteria for the 0.234 acceptance rule. Journal of Applied Probability, 50(1), 1–15. https://doi.org/10.1239/jap/1363784420
Tanner, M. A., & Wong, W. H. (1987). The calculation of posterior distributions by data augmentation. Journal of the American Statistical Association, 82(398), 528–540. https://doi.org/10.1080/01621459.1987.10478458

Comment about Bayesian LASSO