![]()
Using open data to teach reproducibility
SSC Annual meeting
Wednesday, May 28, 2025
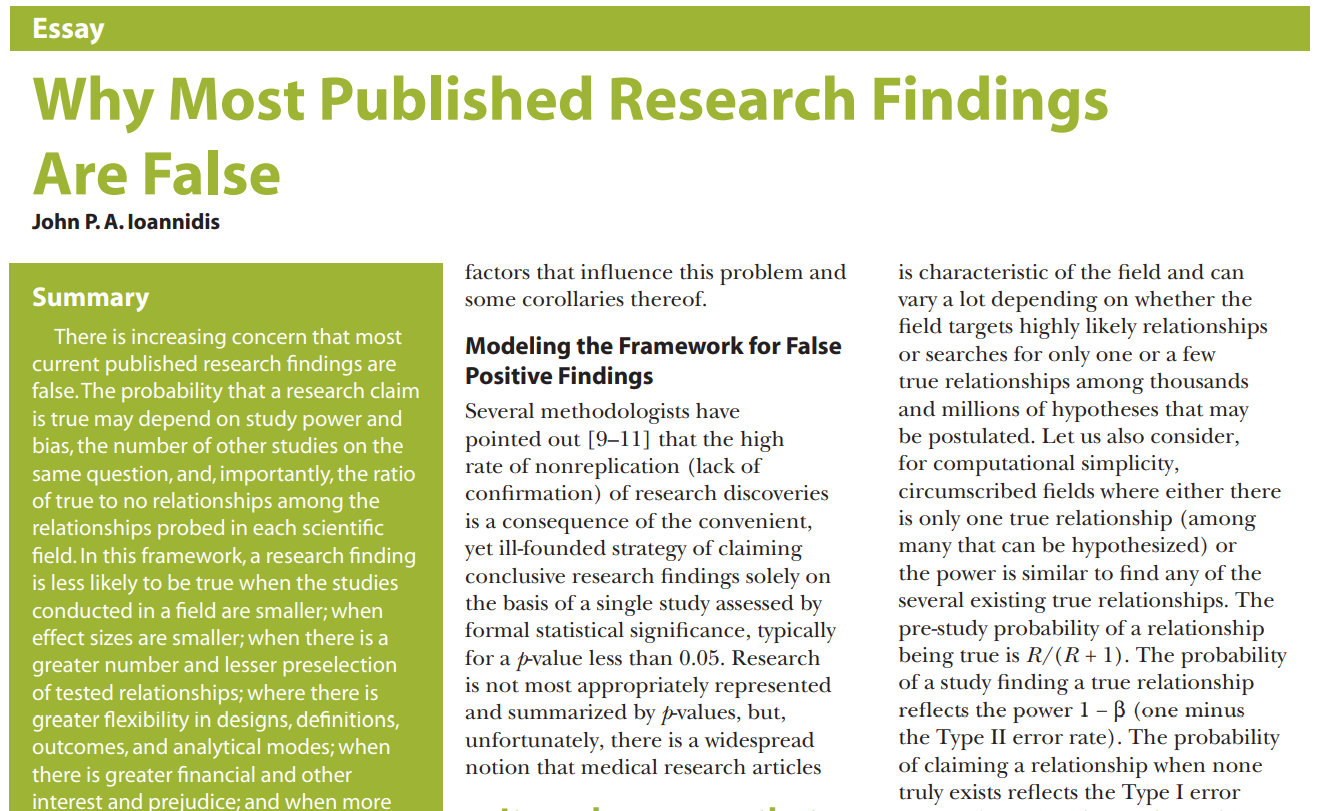
Reproducibility crisis
Defining reproducibility
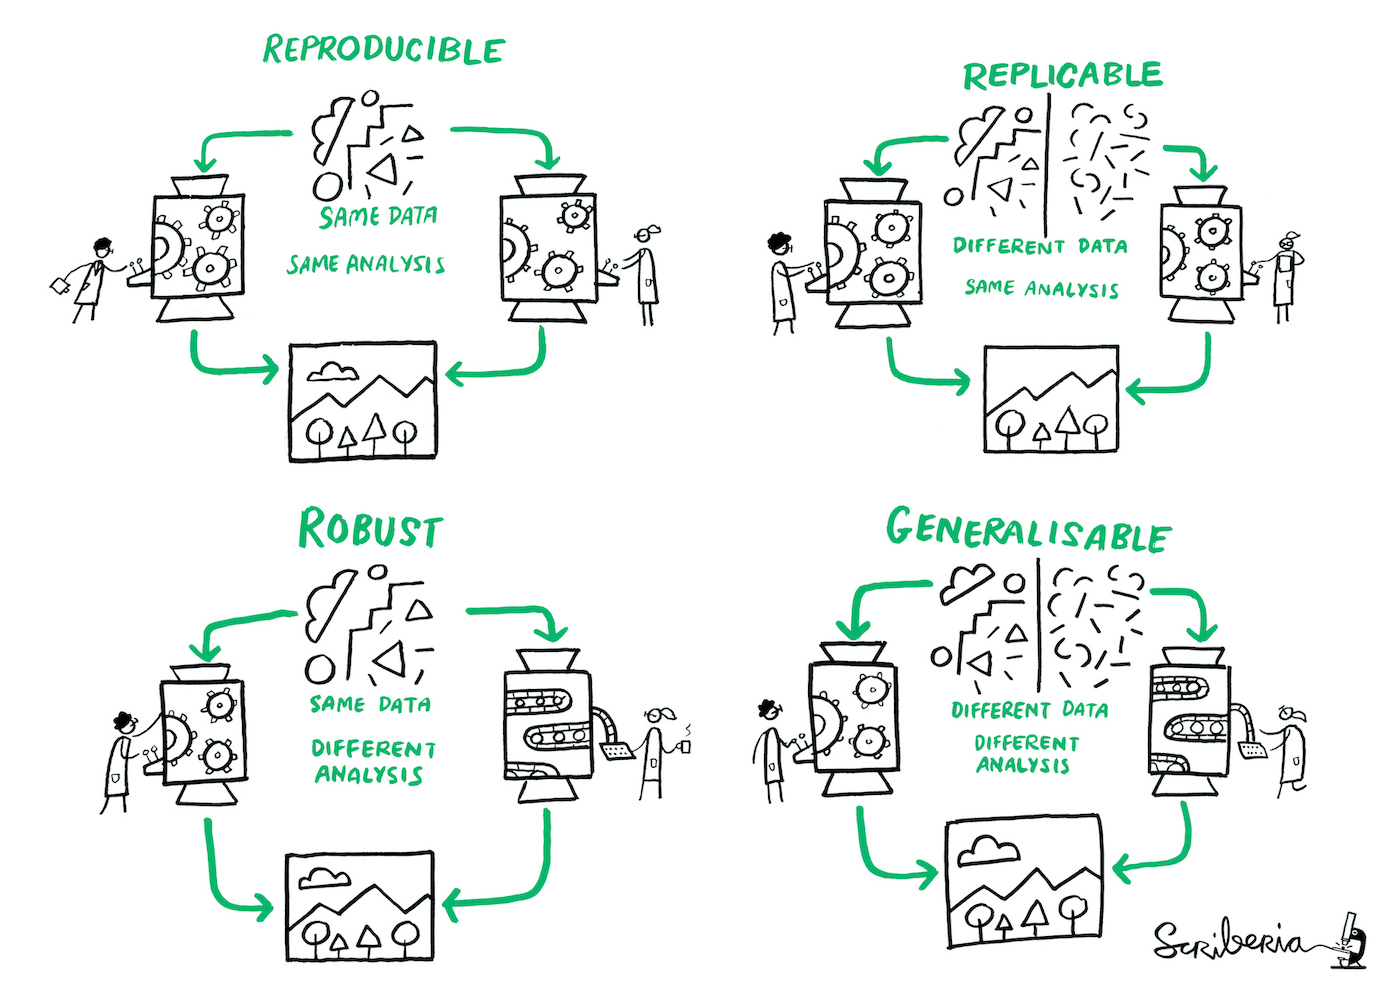
Definition of different dimensions of reproducible research (from The Turing Way project, illustration by Scriberia).
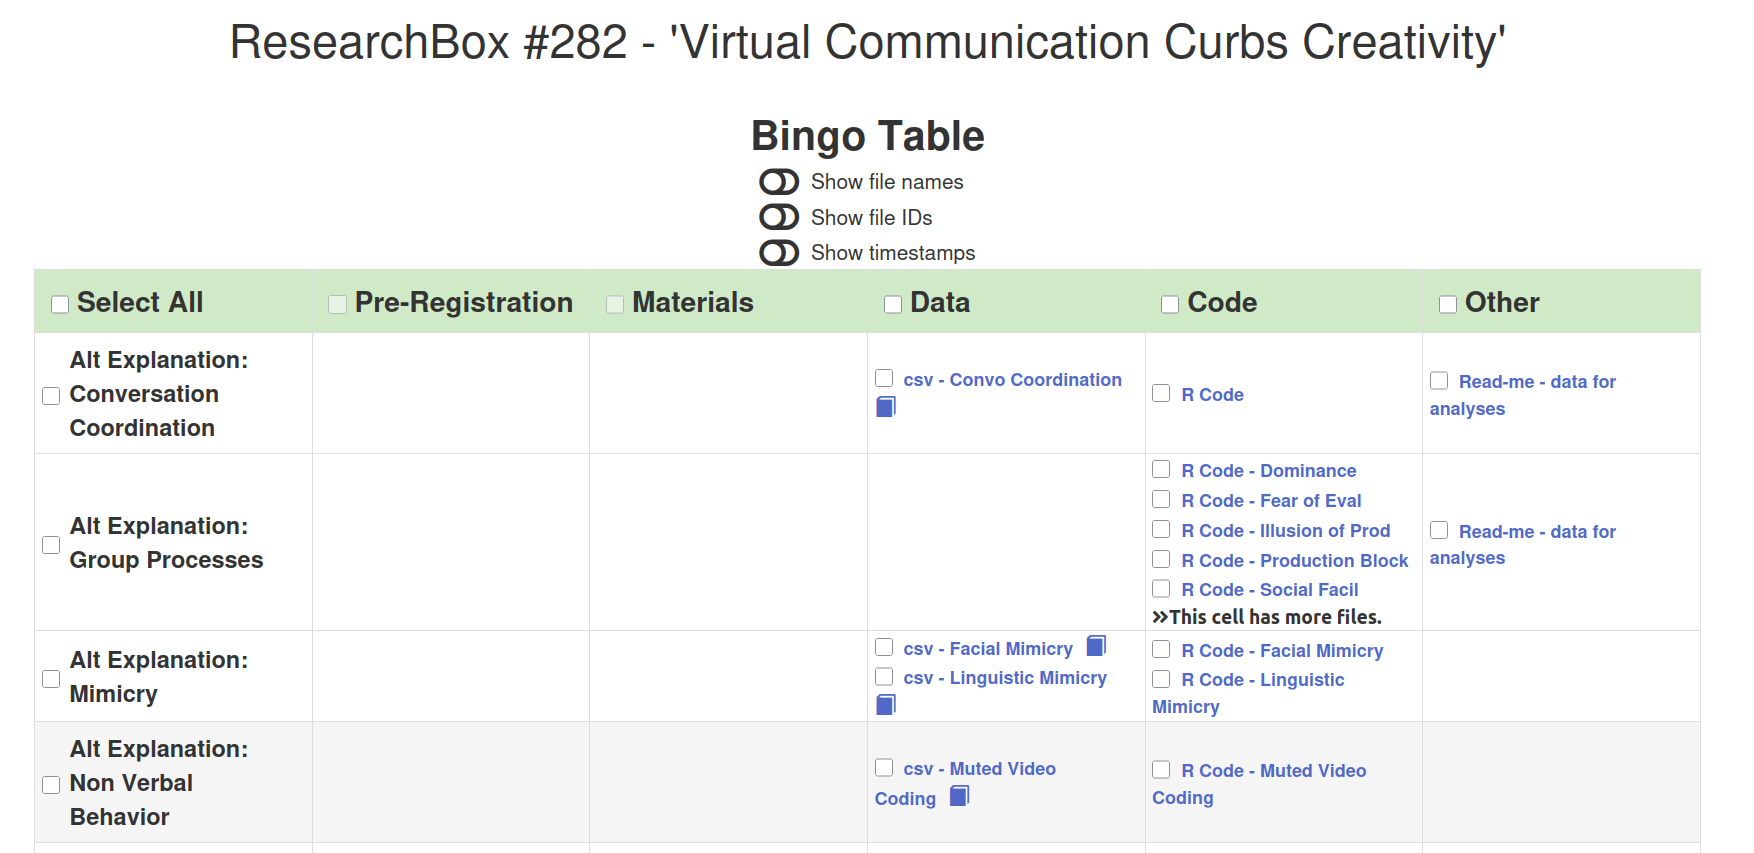
How to find open data
- Data drawn from Open Science Foundation (OSF) or ResearchBox
- Use search with keywords (abstract, or code)
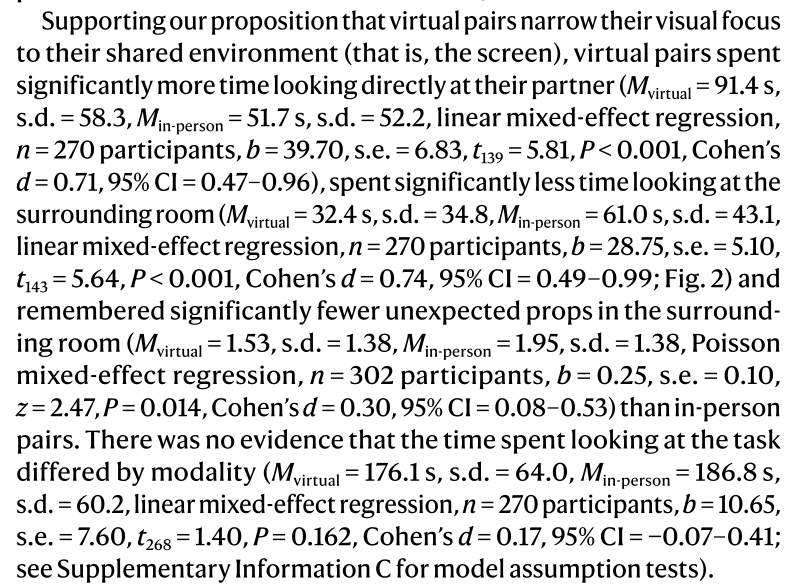
1. Impact of videoconferencing on idea generation
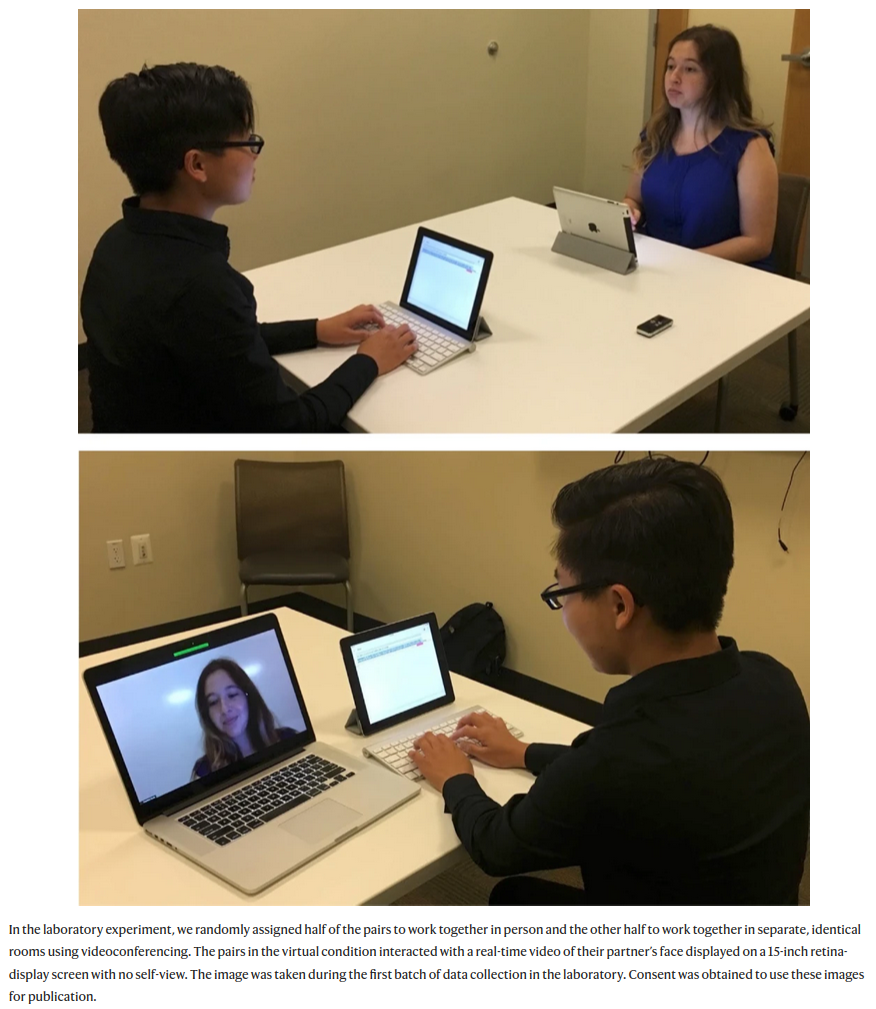
Brucks and Levav (2022)
In a laboratory study […] we demonstrate that videoconferencing hampers idea generation because it focuses communicators on a screen, which prompts a narrower cognitive focus. Our results suggest that virtual interaction comes with a cognitive cost for creative idea generation.
(Subjective) measurement of the number of creative ideas, variety of models that can be fit, comparing different tests.
- Model: Linear mixed model, negative binomial regression
2. Suggesting amounts for donations
Moon and VanEpps (2023)
Across seven studies, we provide evidence that quantity requests, wherein people consider multiple choice options of how much to donate (e.g., $5, $10, or $15), increase contributions compared to open-ended requests.
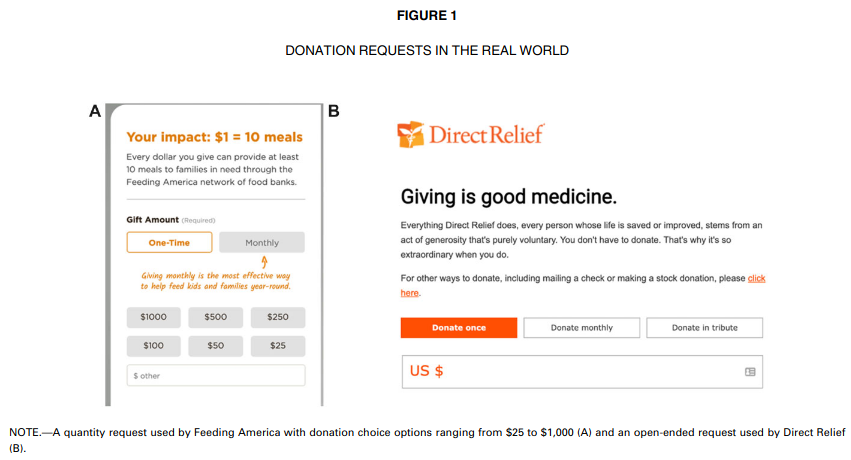
Our findings offer new conceptual insights into how quantity requests increase contributions as well as practical implications for charitable organizations to optimize contributions by leveraging the use of quantity requests.
Model: Tobit type II regression and Poisson regression (independence test)
3. Integrated decisions in online shopping
Duke and Amir (2023)
Customers must often decide on the quantity to purchase in addition to whether to purchase. The current research introduces and compares the quantity-sequential selling format, in which shoppers resolve the purchase and quantity decisions separately, with the quantity-integrated selling format, where shoppers simultaneously consider whether and how many to buy. Although retailers often use the sequential format, we demonstrate that the integrated format can increase purchase rates.

Model: logistic regression.
Refactoring and contrasts
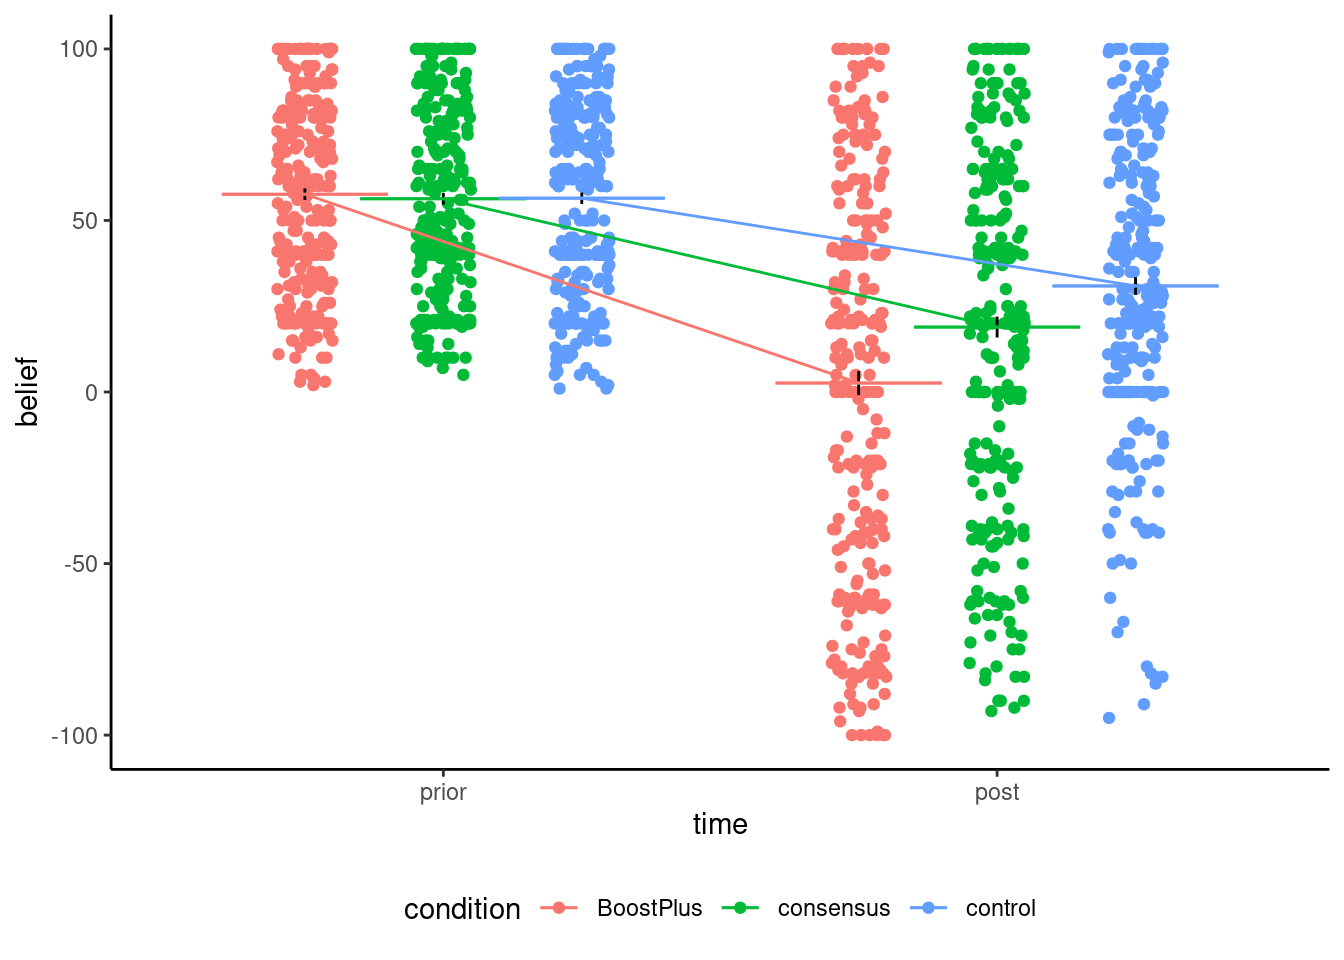
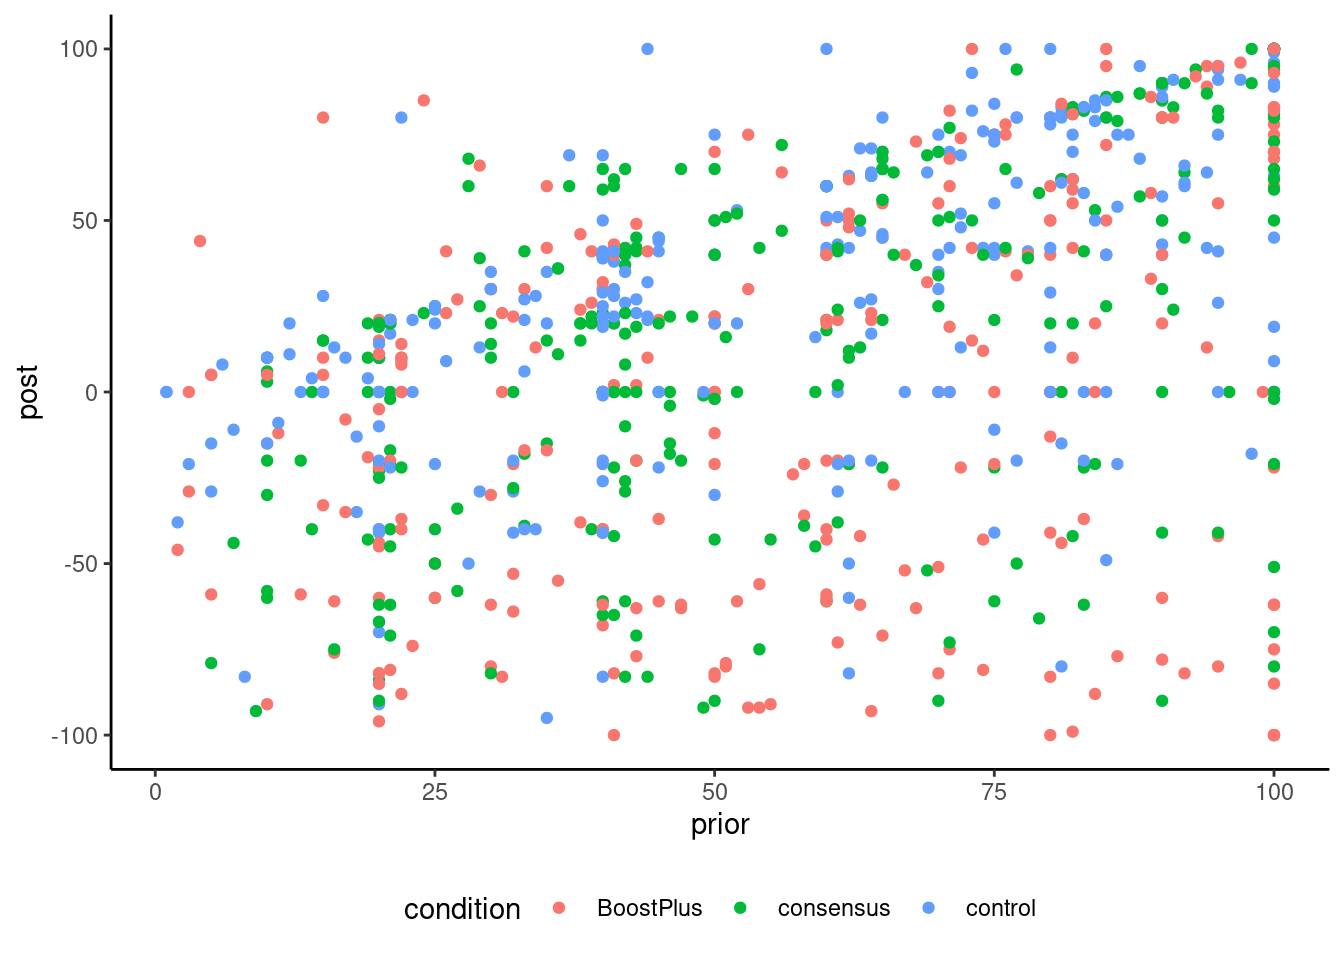
5. Boosting understanding of scientific consensus to correct false beliefs
Stekelenburg et al. (2021)
In three experiments with more than 1,500 U.S. adults who held false beliefs, participants first learned the value of scientific consensus and how to identify it. Subsequently, they read a news article with information about a scientific consensus opposing their beliefs.
Model: 3 group between-subject ANCOVA
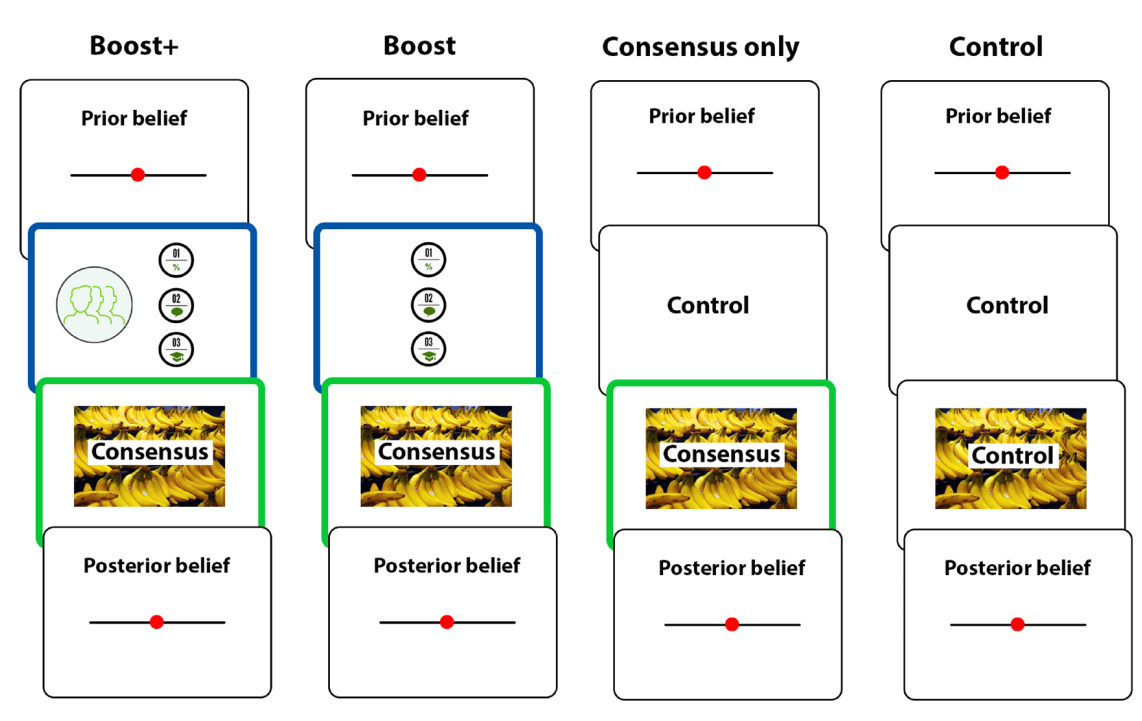
Belief of harm of genetically engineered food
Preregisted, choice of topic (Study 1 on climate change produced no difference), second study underpowered, power calculation, scale of measurement and response, population heterogeneity
Maximally uninteresting
Often, results section formatting is terse and procedural. Students find them intimidating (akin to an unknown foreign language).
Students must nevertheless learn to criticize statistical methodology and spot potential problems.
6. Social presence in social media products
Poirier et al. (2024)