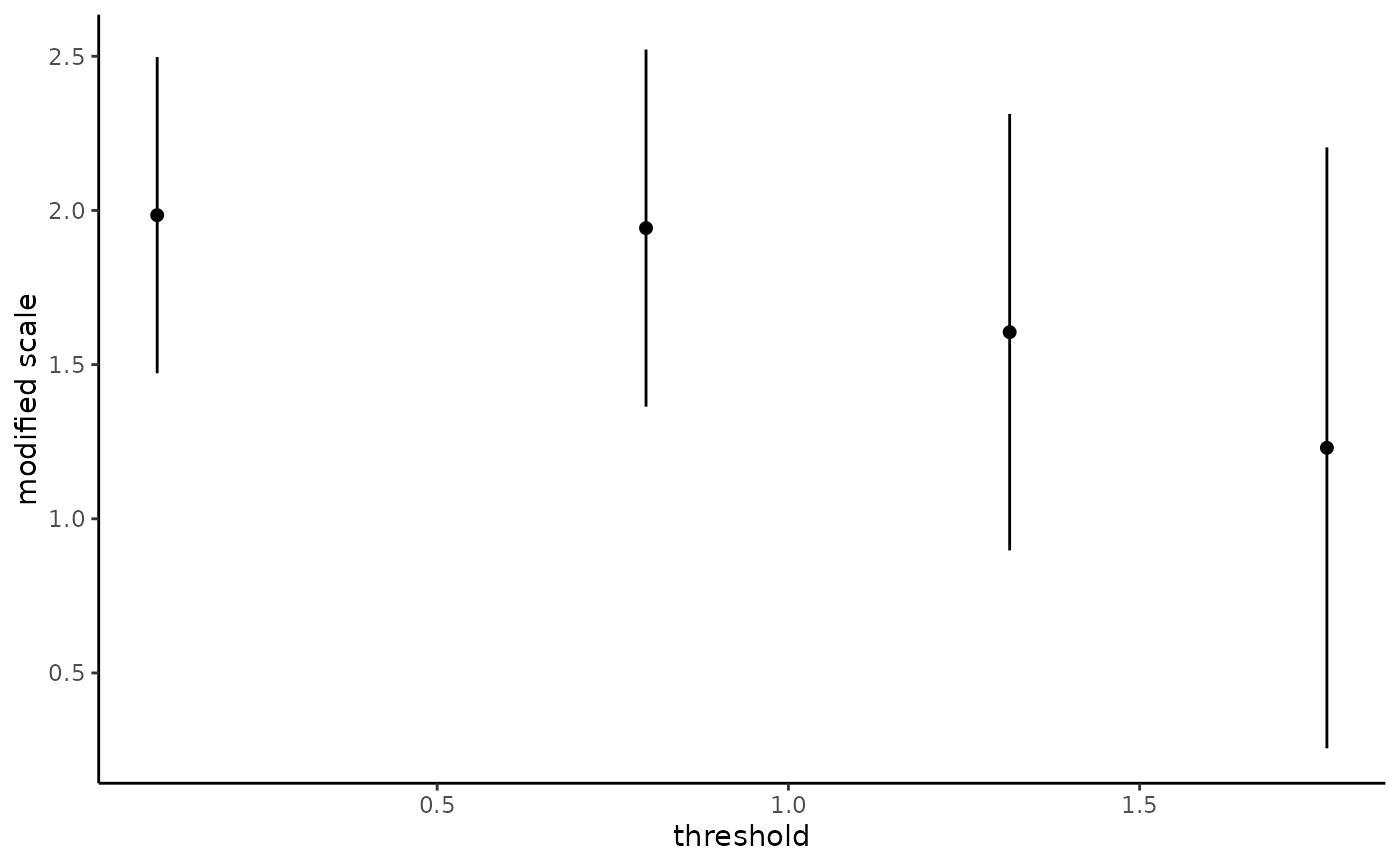
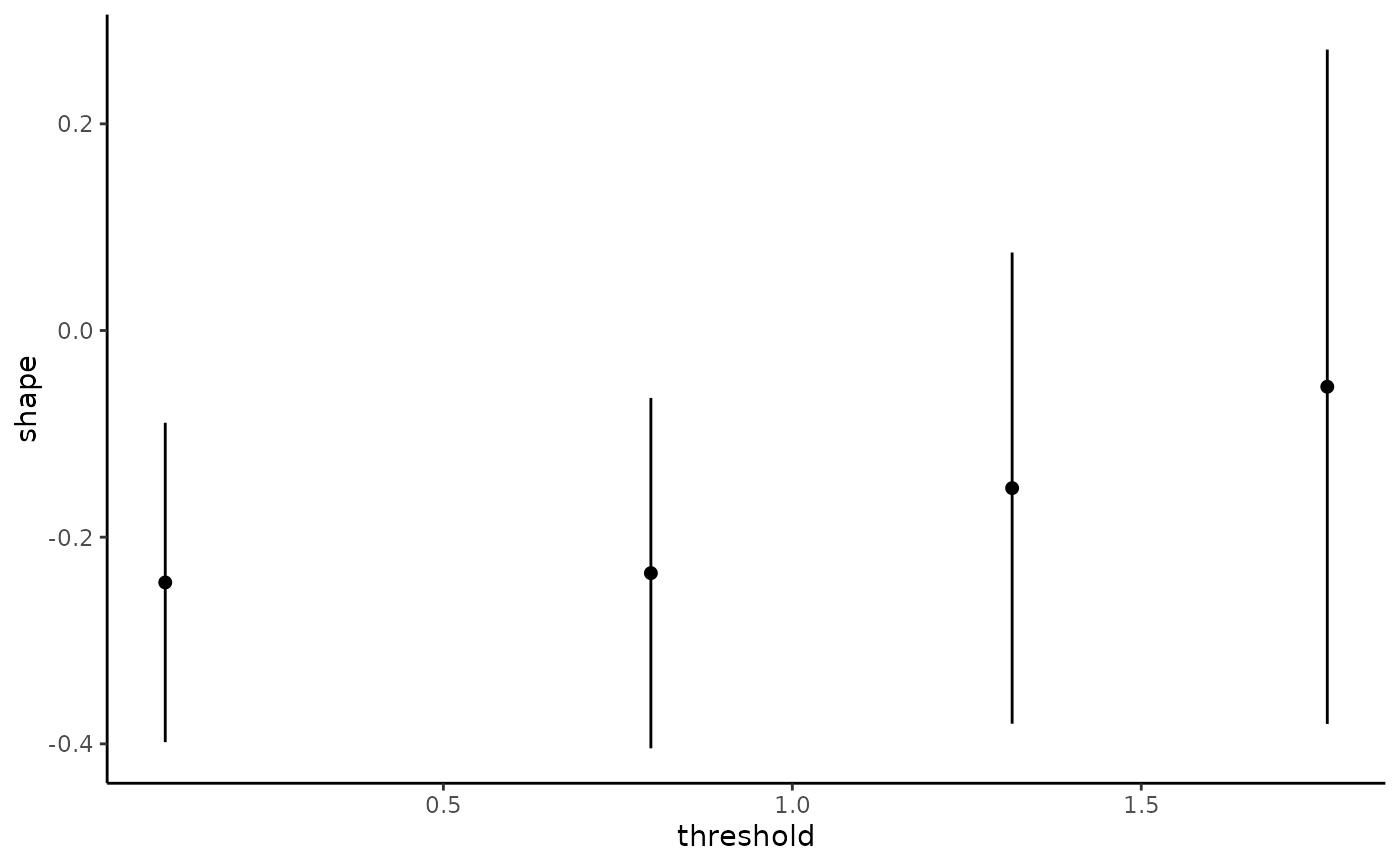
The generalized Pareto and exponential distribution are threshold stable. This property, which is used for extrapolation purposes, can also be used to diagnose goodness-of-fit: we expect the parameters \(\xi\) and \(\tilde{\sigma} = \sigma + \xi u\) to be constant over a range of thresholds. The threshold stability plot consists in plotting maximum likelihood estimates with pointwise confidence interval. This function handles interval truncation and right-censoring.
Usage
tstab(
  time,
  time2 = NULL,
  event = NULL,
  thresh = 0,
  ltrunc = NULL,
  rtrunc = NULL,
  type = c("right", "left", "interval", "interval2"),
  family = c("gp", "exp"),
  method = c("wald", "profile"),
  level = 0.95,
  plot = TRUE,
  plot.type = c("base", "ggplot"),
  which.plot = c("scale", "shape"),
  weights = NULL,
  arguments = NULL,
  ...
)
Arguments
- time
excess time of the event of follow-up time, depending on the value of event
- time2
ending excess time of the interval for interval censored data only.
- event
status indicator, normally 0=alive, 1=dead. Other choices are
TRUE/FALSE(TRUEfor death). For interval censored data, the status indicator is 0=right censored, 1=event at time, 2=left censored, 3=interval censored. Although unusual, the event indicator can be omitted, in which case all subjects are assumed to have experienced an event.- thresh
vector of thresholds
- ltrunc
lower truncation limit, default to
NULL- rtrunc
upper truncation limit, default to
NULL- type
character string specifying the type of censoring. Possible values are "
right", "left", "interval", "interval2".- family
string; distribution, either generalized Pareto (
gp) or exponential (exp)- method
string; the type of pointwise confidence interval, either Wald (
wald) or profile likelihood (profile)- level
probability level for the pointwise confidence intervals
- plot
logical; should a plot be returned alongside with the estimates? Default to
TRUE- plot.type
string; either
basefor base R plots orggplotforggplot2plots- which.plot
string; which parameters to plot;
- weights
weights for observations
- arguments
a named list specifying default arguments of the function that are common to all
elifecalls- ...
additional arguments for optimization, currently ignored.
Value
an invisible list with pointwise estimates and confidence intervals for the scale and shape parameters
See also
tstab.gpd from package mev, gpd.fitrange from package ismev or tcplot from package evd, among others.
Examples
set.seed(1234)
n <- 100L
x <- samp_elife(n = n,
                scale = 2,
                shape = -0.2,
                lower = low <- runif(n),
                upper = upp <- runif(n, min = 3, max = 20),
                type2 = "ltrt",
                family = "gp")
tstab_plot <- tstab(time = x,
                    ltrunc = low,
                   rtrunc = upp,
                   thresh = quantile(x, seq(0, 0.5, length.out = 4)))


plot(tstab_plot, plot.type = "ggplot")