This function computes the empirical coefficient of variation and computes a weighted statistic comparing the squared distance with the theoretical coefficient variation corresponding to a specific shape parameter (estimated from the data using a moment estimator as the value minimizing the test statistic, or using maximum likelihood). The procedure stops if there are no more than 10 exceedances above the highest threshold.
Usage
thselect.cv(
  xdat,
  thresh,
  method = c("mle", "wcv", "cv"),
  nsim = 999L,
  nthresh = 10L,
  level = 0.05,
  lazy = FALSE,
  plot = FALSE
)
Arguments
- xdat
[vector] vector of observations
- thresh
[vector] vector of threshold. If missing, set to \(p^k\) for \(k=0\) to \(k=\)
nthresh- method
[string], either moment estimator for the (weighted) coefficient of variation (
wcvandcv) or maximum likelihood (mle)- nsim
[integer] number of bootstrap replications
- nthresh
[integer] number of thresholds, if
threshis not supplied by the user- level
[numeric] probability level for sequential testing procedure
- lazy
[logical] compute the bootstrap p-value until the test stops rejecting at level
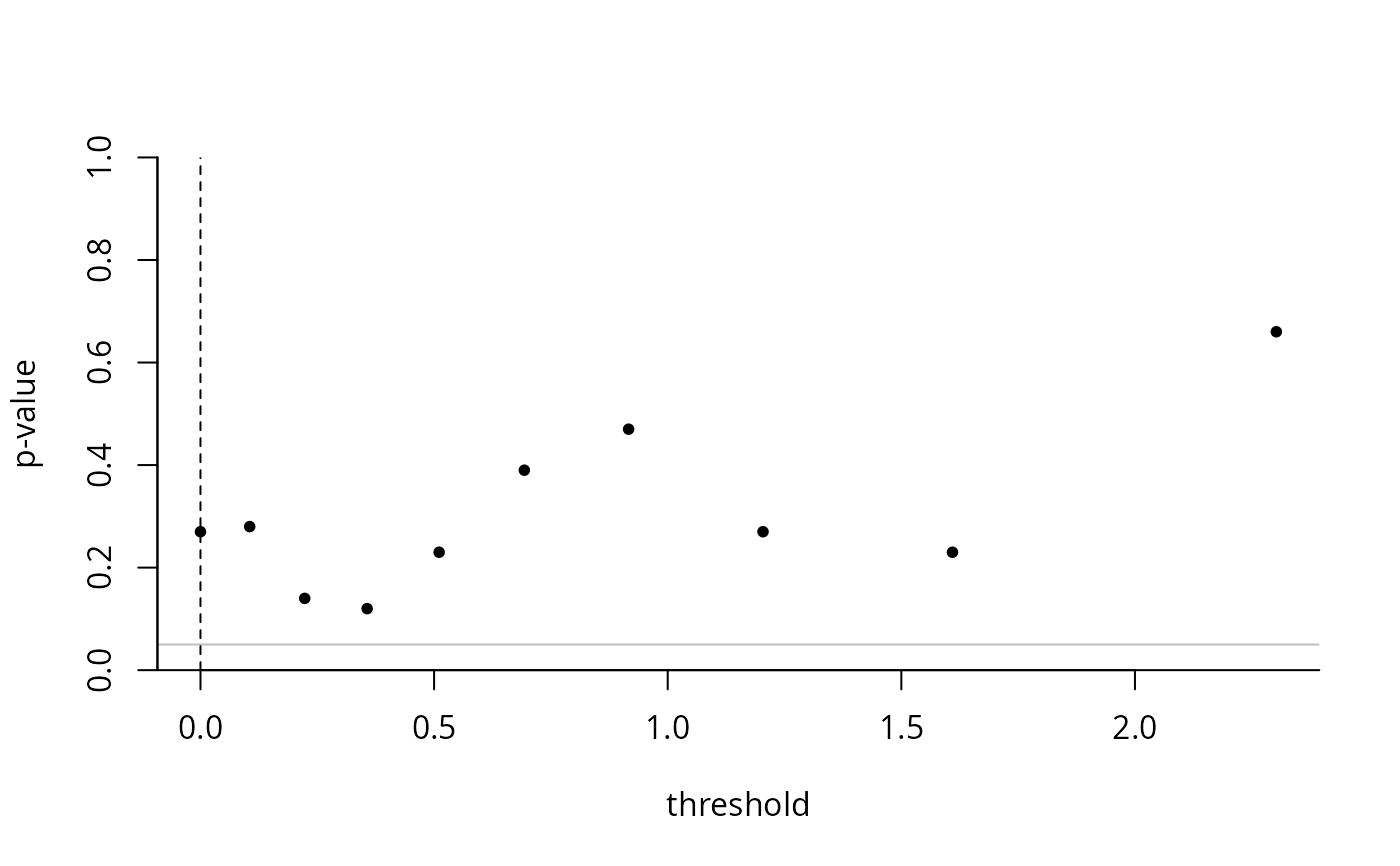
level? Default toFALSE- plot
[logical] if
TRUE, returns a plot of the p-value path
Value
a list with elements
thresh: value of threshold returned by the procedure,NAif the hypothesis is rejected at all thresholdsthresh0: sorted vector of candidate thresholdscindex: index of selected threshold amongthresh0orNAif none returnedpval: bootstrap p-values, withNAiflazyand the p-value exceeds level at lower thresholdsshape: shape parameter estimatesnexc: number of exceedances of each thresholdthresh0method: estimation method for the shape parameter
Note
The authors suggest transformation of $$Y = -1/(X + c) + 1/c,$$ where \(X\) are exceedances and \(c=\sigma/\xi\) is the ratio of estimated scale and shape parameters. For heavy-tailed distributions with \(\xi > 0.25\), this may be preferable, but must be conducted outside of the function.