This function implements the automated proposal from Section 2.2 of Langousis et al. (2016) for mean residual life plots. It returns the threshold that minimize the weighted mean square error and moment estimators for the scale and shape parameter based on weighted least squares.
Arguments
- xdat
[numeric] vector of observations
- thresh
[numeric] vector of thresholds; if missing, uses all order statistics from the 20th largest until
kmaxas candidates- kmax
[integer] maximum number of order statistics
- plot
[logical] if
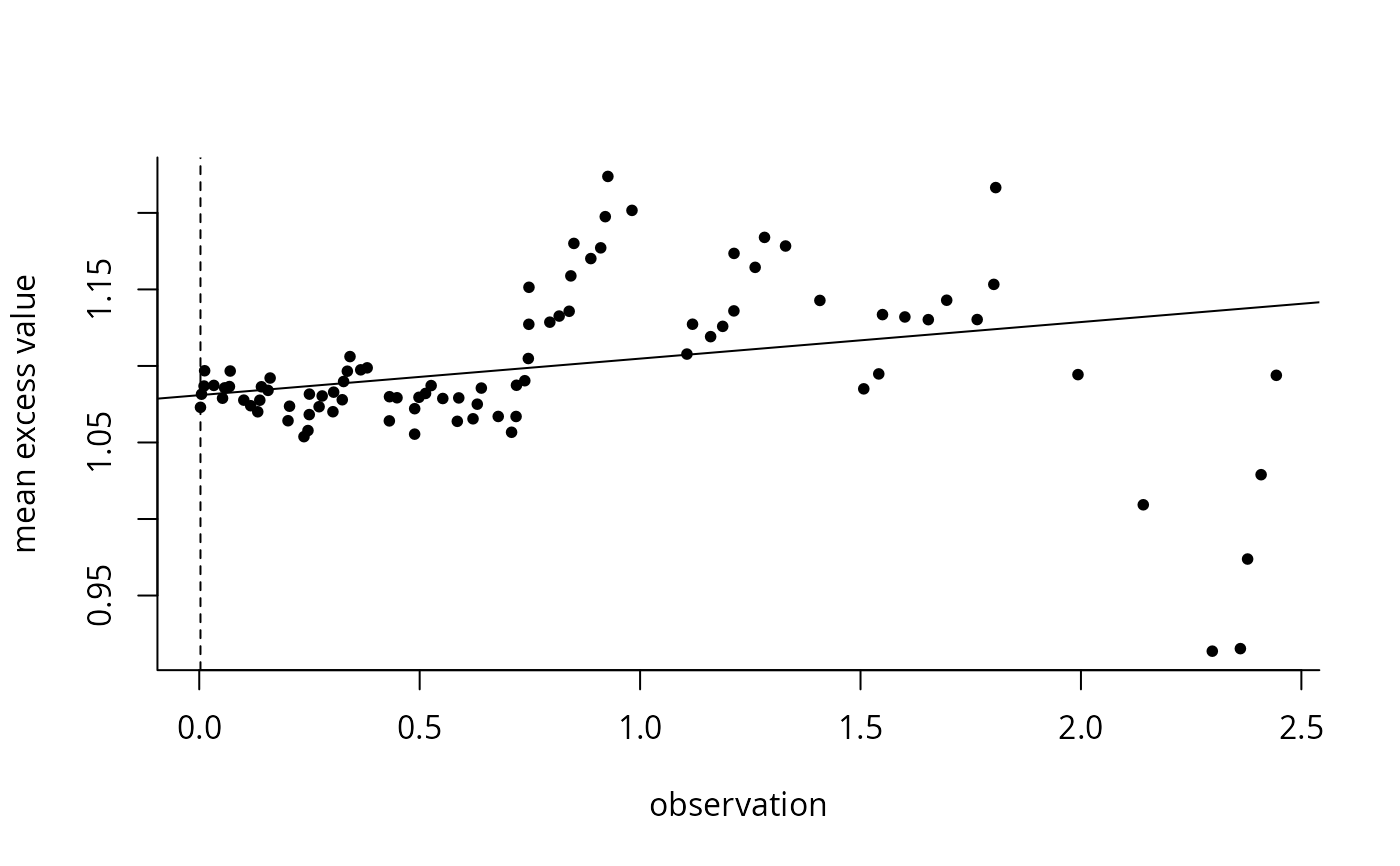
TRUE(default), return a plot of the mean residual life plot with the fitted slope and the chosen threshold- ...
additional arguments, currently ignored
Value
a list containing
thresh: candidate threshold vectorthresh0: selected thresholdscale: scale parameter estimateshape: shape parameter estimatemrl: empirical mean excess valuesxdat: ordered observationsintercept: intercept for mean excess value at chosen thresholdslope: slope for mean excess value at chosen thresholdtmanual: logical;TRUEif the user passed a vector of thresholds
Details
The procedure consists in estimating the usual mean residual life as a function of the threshold, and looking for an order statistic or threshold value above which the fit is more or less linear.
References
Langousis, A., A. Mamalakis, M. Puliga and R. Deidda (2016). Threshold detection for the generalized Pareto distribution: Review of representative methods and application to the NOAA NCDC daily rainfall database, Water Resources Research, 52, 2659–2681.
Examples
thselect.mrl(rgp(n = 100))