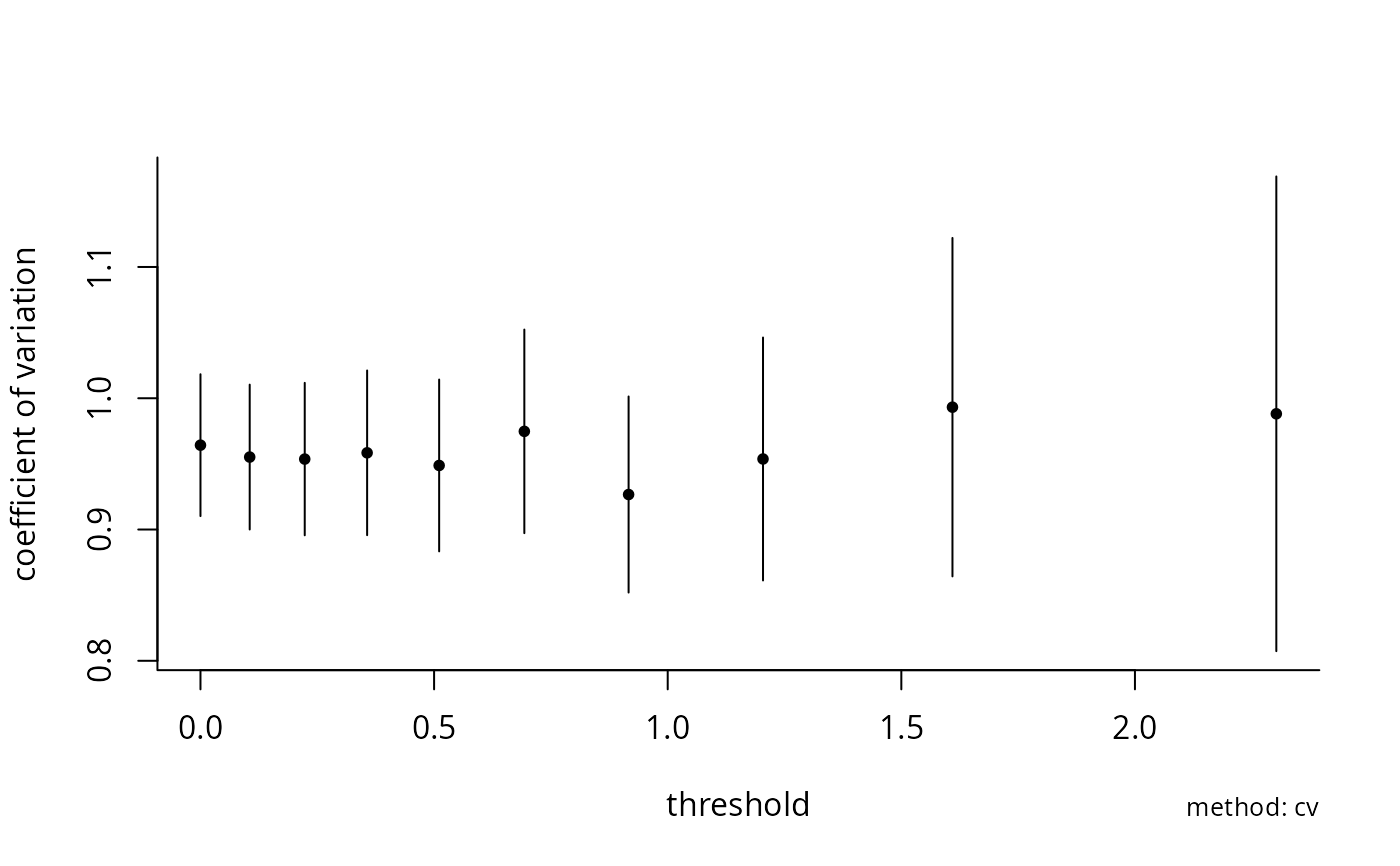
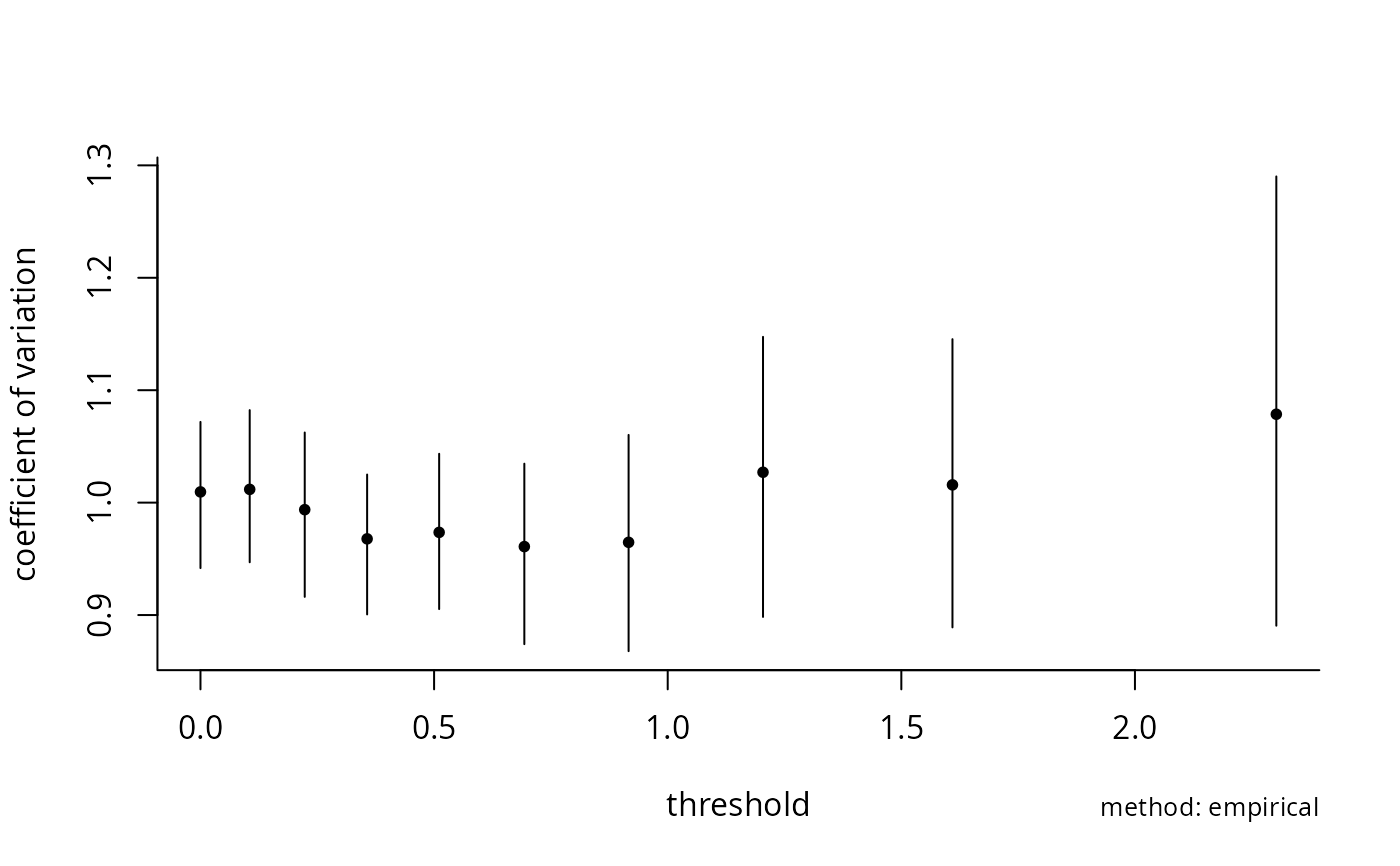
This function calculates parametric estimates of the coefficient of variation with pointwise Wald confidence intervals along with empirical estimates and returns a threshold stability plot.
Usage
tstab.cv(
  xdat,
  thresh,
  method = c("empirical", "mle", "wcv", "cv"),
  nthresh = 10L,
  nsim = 99L,
  plot = TRUE,
  level = 0.95,
  ...
)
Arguments
- xdat
[vector] vector of observations
- thresh
[vector] vector of threshold. If missing, set to \(p^k\) for \(k=0\) to \(k=\)
nthresh- method
[string], either moment estimator for the (weighted) coefficient of variation (
wcvandcv) or maximum likelihood (mle)- nthresh
[integer] number of thresholds, if
threshis not supplied by the user- nsim
[integer] number of bootstrap replications
- plot
[logical] if
TRUE, returns a plot of the p-value path- level
[numeric] probability level for sequential testing procedure
- ...
additional parameters, notably for package
boot, for thetypeof confidence intervals.