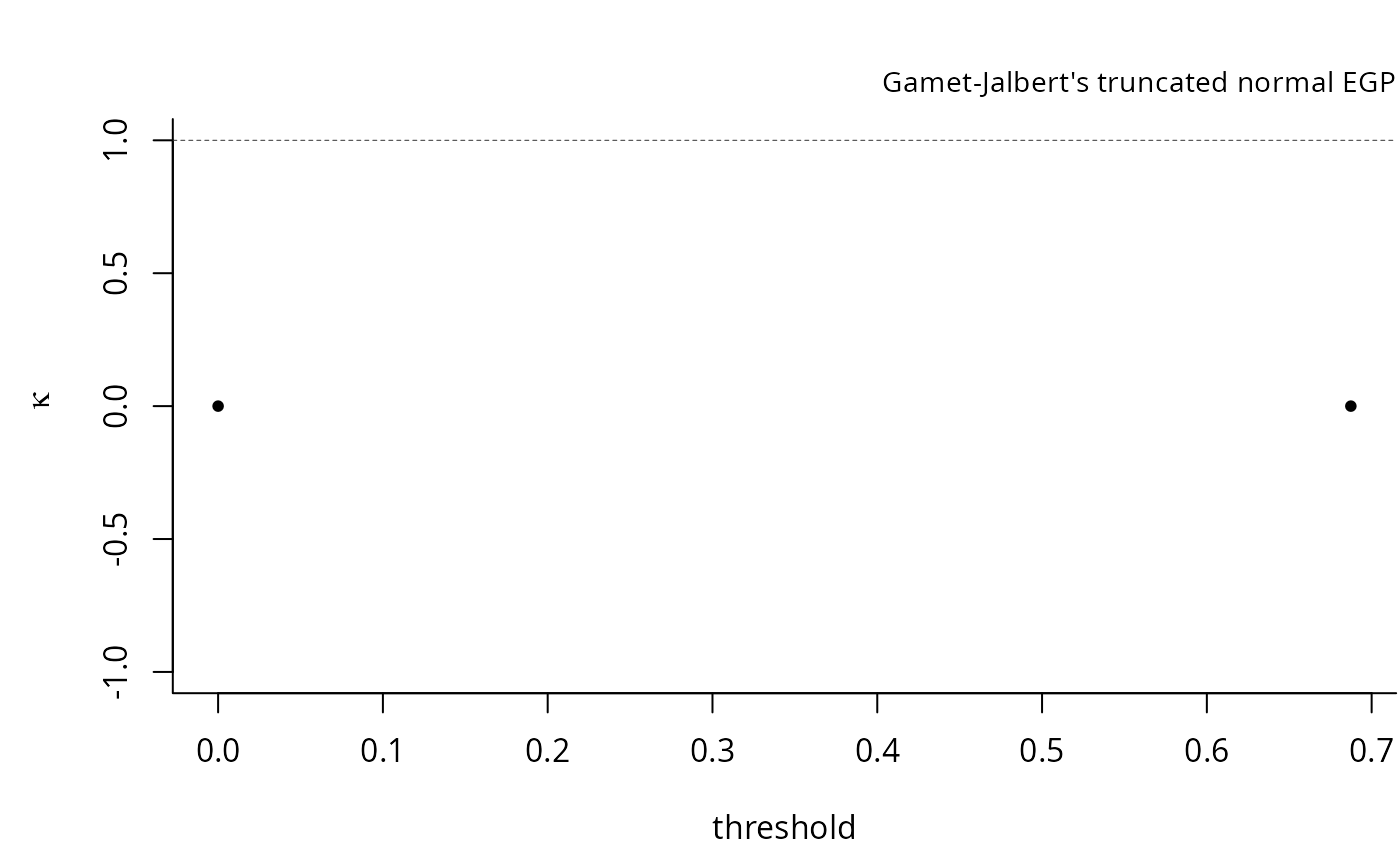
Threshold stability plots for extended generalized Pareto models
Arguments
- xdat
vector of observations, greater than the threshold
- thresh
threshold value
- model
a string indicating which extended family to fit
- param
[string] parameter, either
shapeor additional parameterkappa- type
[string] confidence interval type, either
waldorprofile.- transform
logical; if
TRUEandtype="wald", intervals forkappaare computed on the log-scale and back-transformed.- level
[double] confidence interval level, default to 0.95.
- plot
[logical] if
TRUE(default), return a threshold stability plot- ...
additional arguments for the plot function, currently ignored.