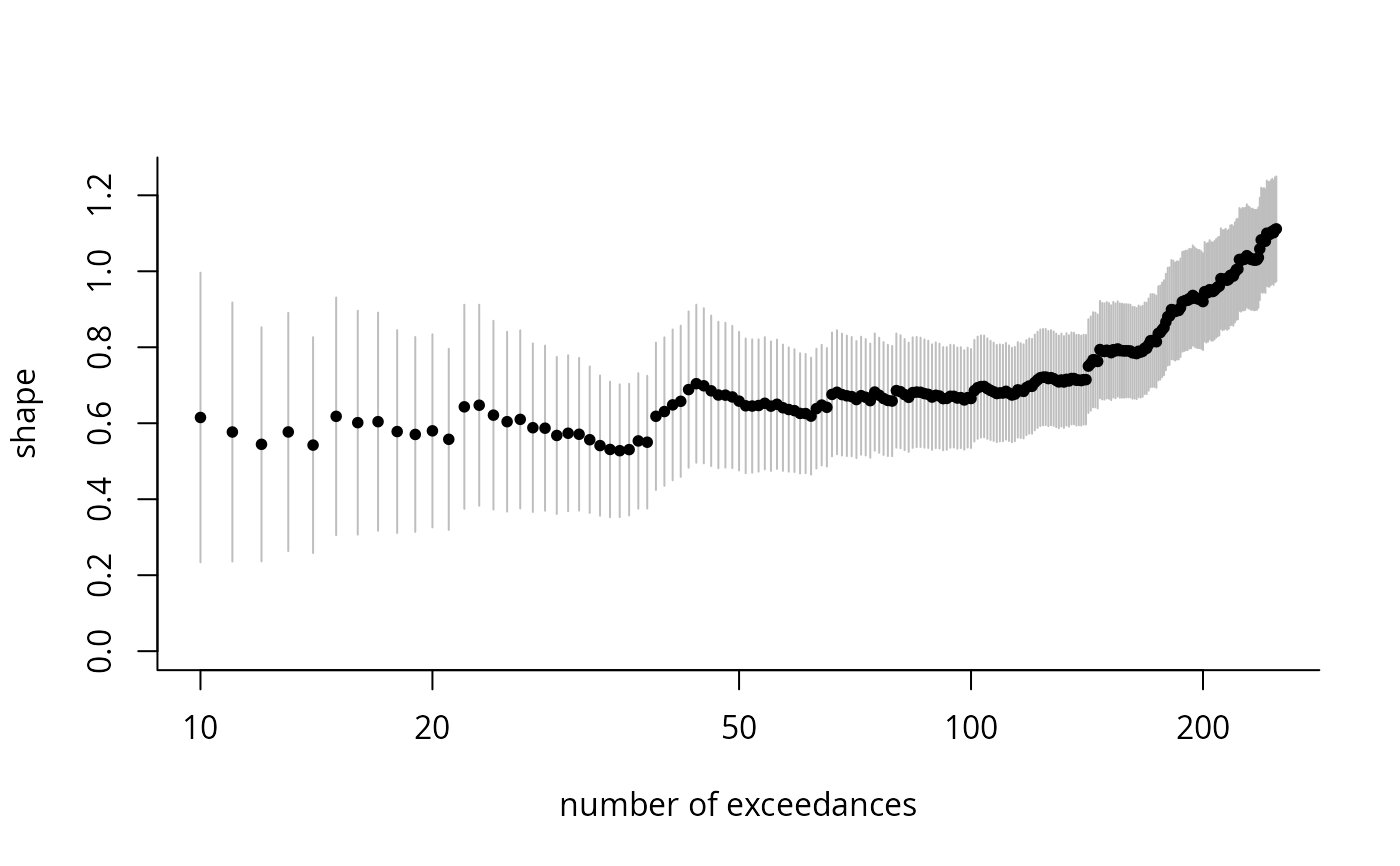
Threshold stability plot for Hill estimator
Arguments
- xdat
[vector] sample exceedances
- kmax
[int] maximum number of order statistics
- method
[string] name of estimator for shape parameter. Default to
hill.- ...
additional arguments passed to
fit.shapefor certain methods.- log
[logical] should the x-axis for the number of order statistics used for estimation be displayed on the log scale? Default to
TRUE
Examples
xdat <- rgp(n = 250, loc = 1, scale = 2, shape = 0.5)
tstab.hill(xdat)