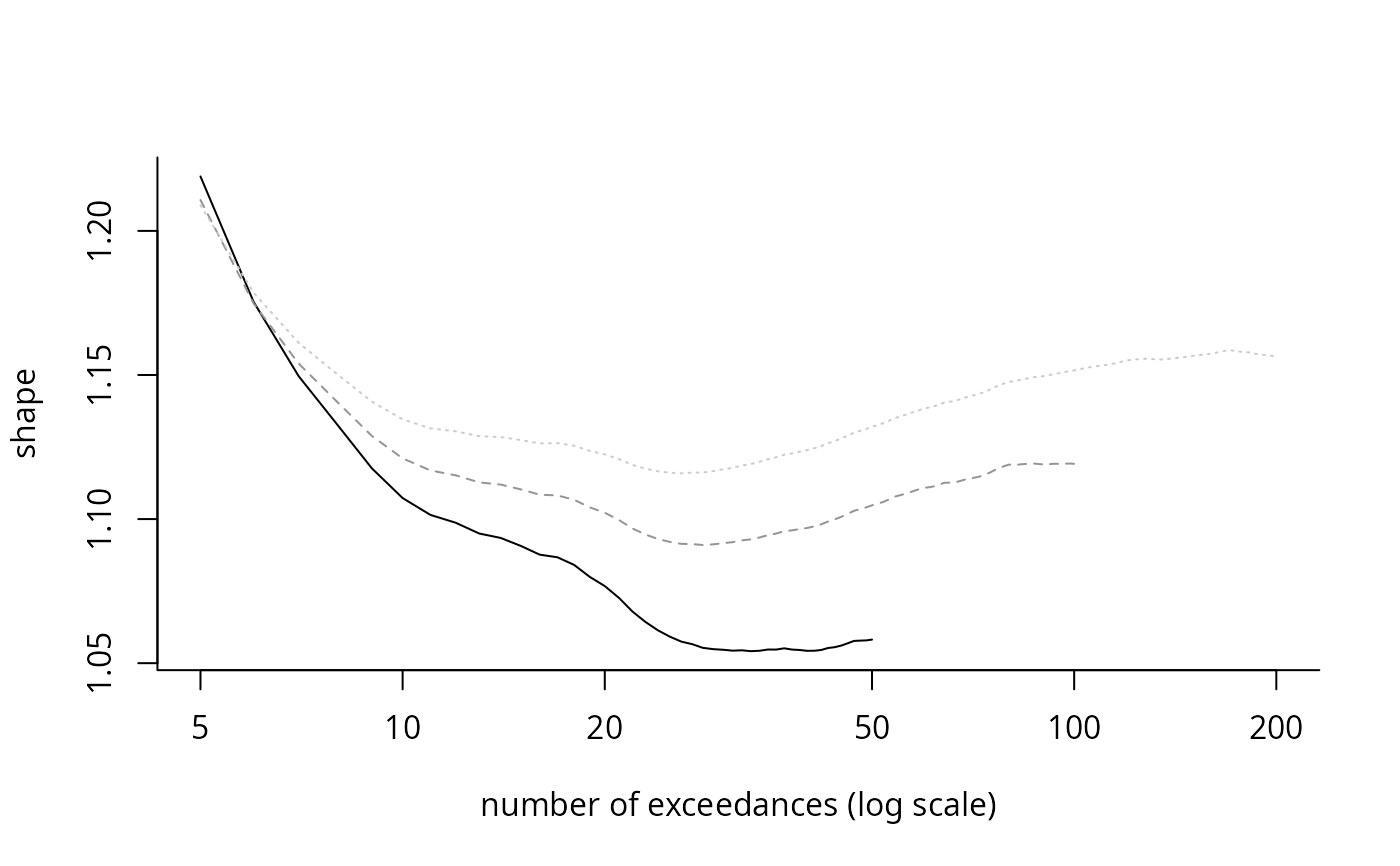
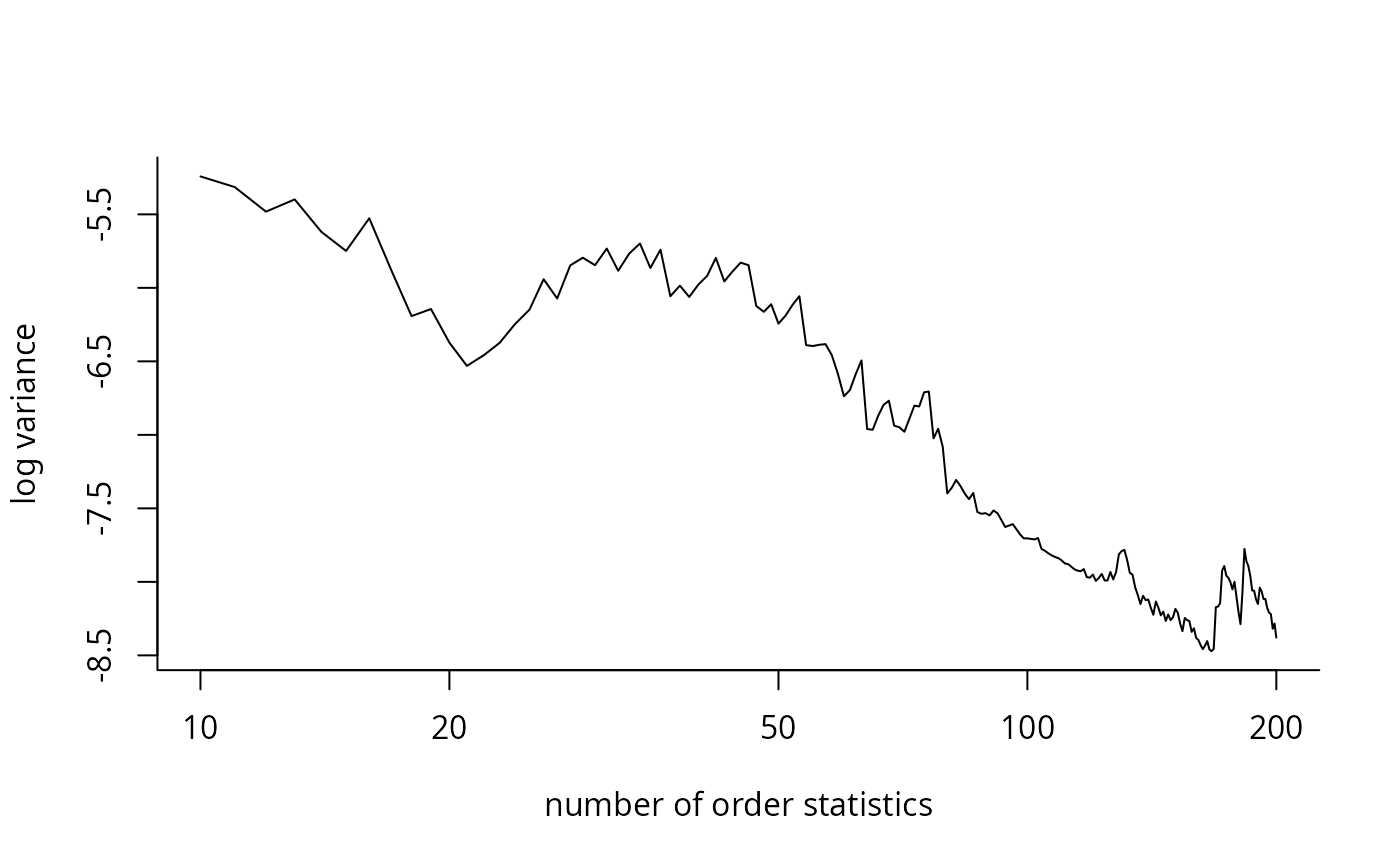
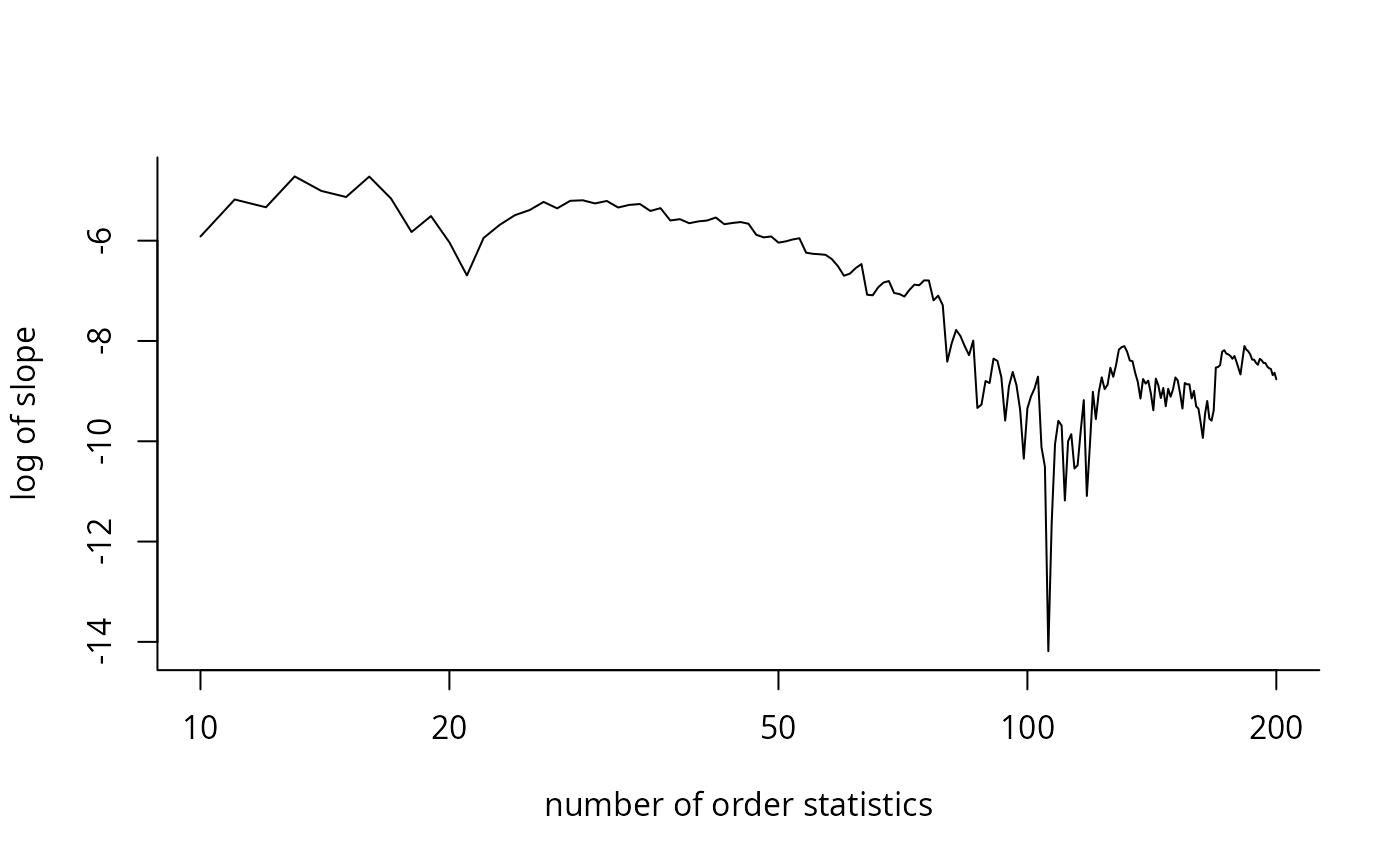
Given a vector of exceedances and some potential choices of \(k\) for the threshold, compute the left-truncated Hill estimators for each value of k and use these to compute the variance and slope of the estimator
Usage
tstab.lthill(xdat, k, which = c("lthill", "var", "slope"), log = TRUE, ...)Arguments
- xdat
[numeric] vector of positive observations
- k
[integer] number of order statistics for the threshold
- which
[string] the type of plot, showing the left-truncated Hill plot on the log, the log of the variance of the estimator, or the log slope
- log
[logical] if
TRUE(default), shows the Hill plot on the log-scale- ...
additional parameters for color, etc. to be passed to plot
References
Bladt, M., Albrecher, H. & Beirlant, J. (2020) Threshold selection and trimming in extremes. Extremes, 23, 629-665 . doi:10.1007/s10687-020-00385-0