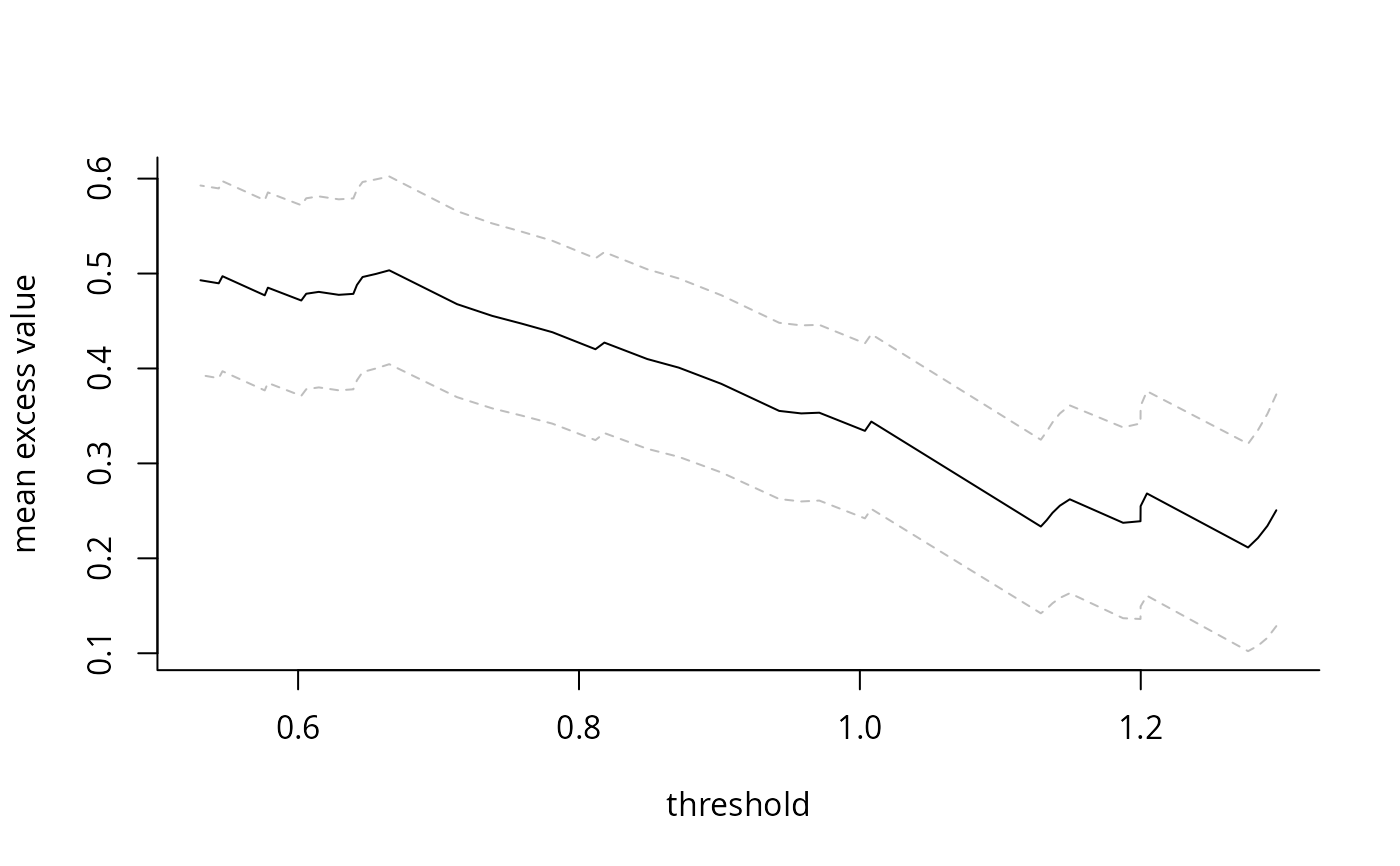
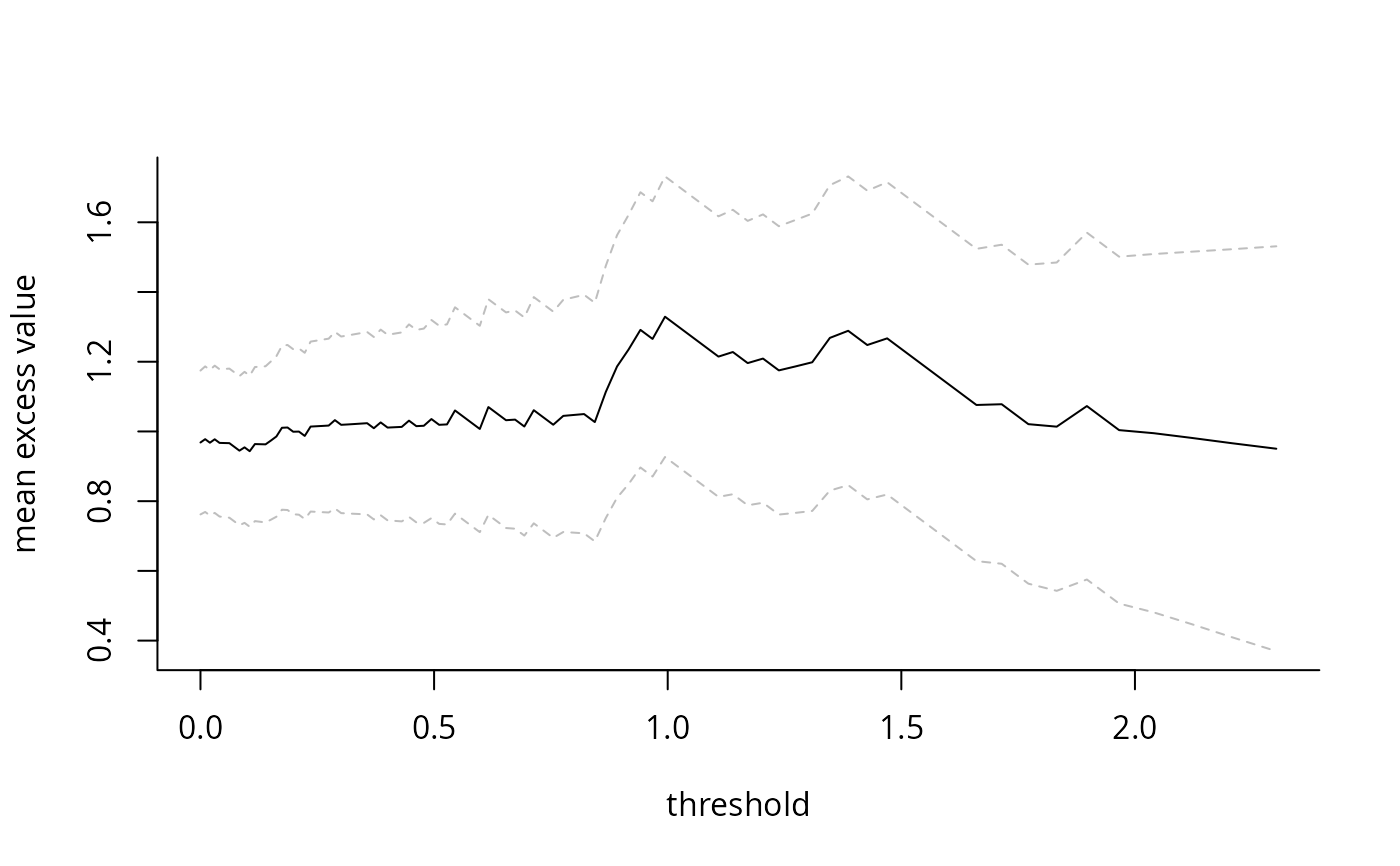
Computes mean of sample exceedances over a range of thresholds or for a pre-specified number of largest order statistics, and returns a plot with 95% Wald-based confidence intervals as a function of either the threshold or the number of exceedances. The main purpose is the plotting method, which generates the so-called mean residual life plot. The latter should be approximately linear over the threshold for a generalized Pareto distribution
Arguments
- xdat
vector of sample observations
- thresh
vector of thresholds
- kmin
integer giving the minimum number of exceedances; ignored if
threshis provided. Default to 10- kmax
integer giving the maximum number of exceedances; ignored if
threshis provided. Default to sample size.- plot
logical; if
TRUE, call the plot method- level
double giving the level of confidence intervals for the plot, default to 0.95
- xlab
string indicating whether to use thresholds (
thresh) or number of largest order statistics (nexc) for the x-axis- type
string whether to plot pointwise confidence intervals using segments (
"ptwise") or using dashed lines ("band")- ...
additional arguments, currently ignored
Value
an invisible list with mean sample exceedances and standard deviation, number of exceedances, threshold