Graphical diagnostics
We consider a regression model with two covariates, age (in years) and the categorical variable education and no interaction. Based on the diagnostic plots in the Figures, what is the most likely violation of the model assumptions for each scenario?
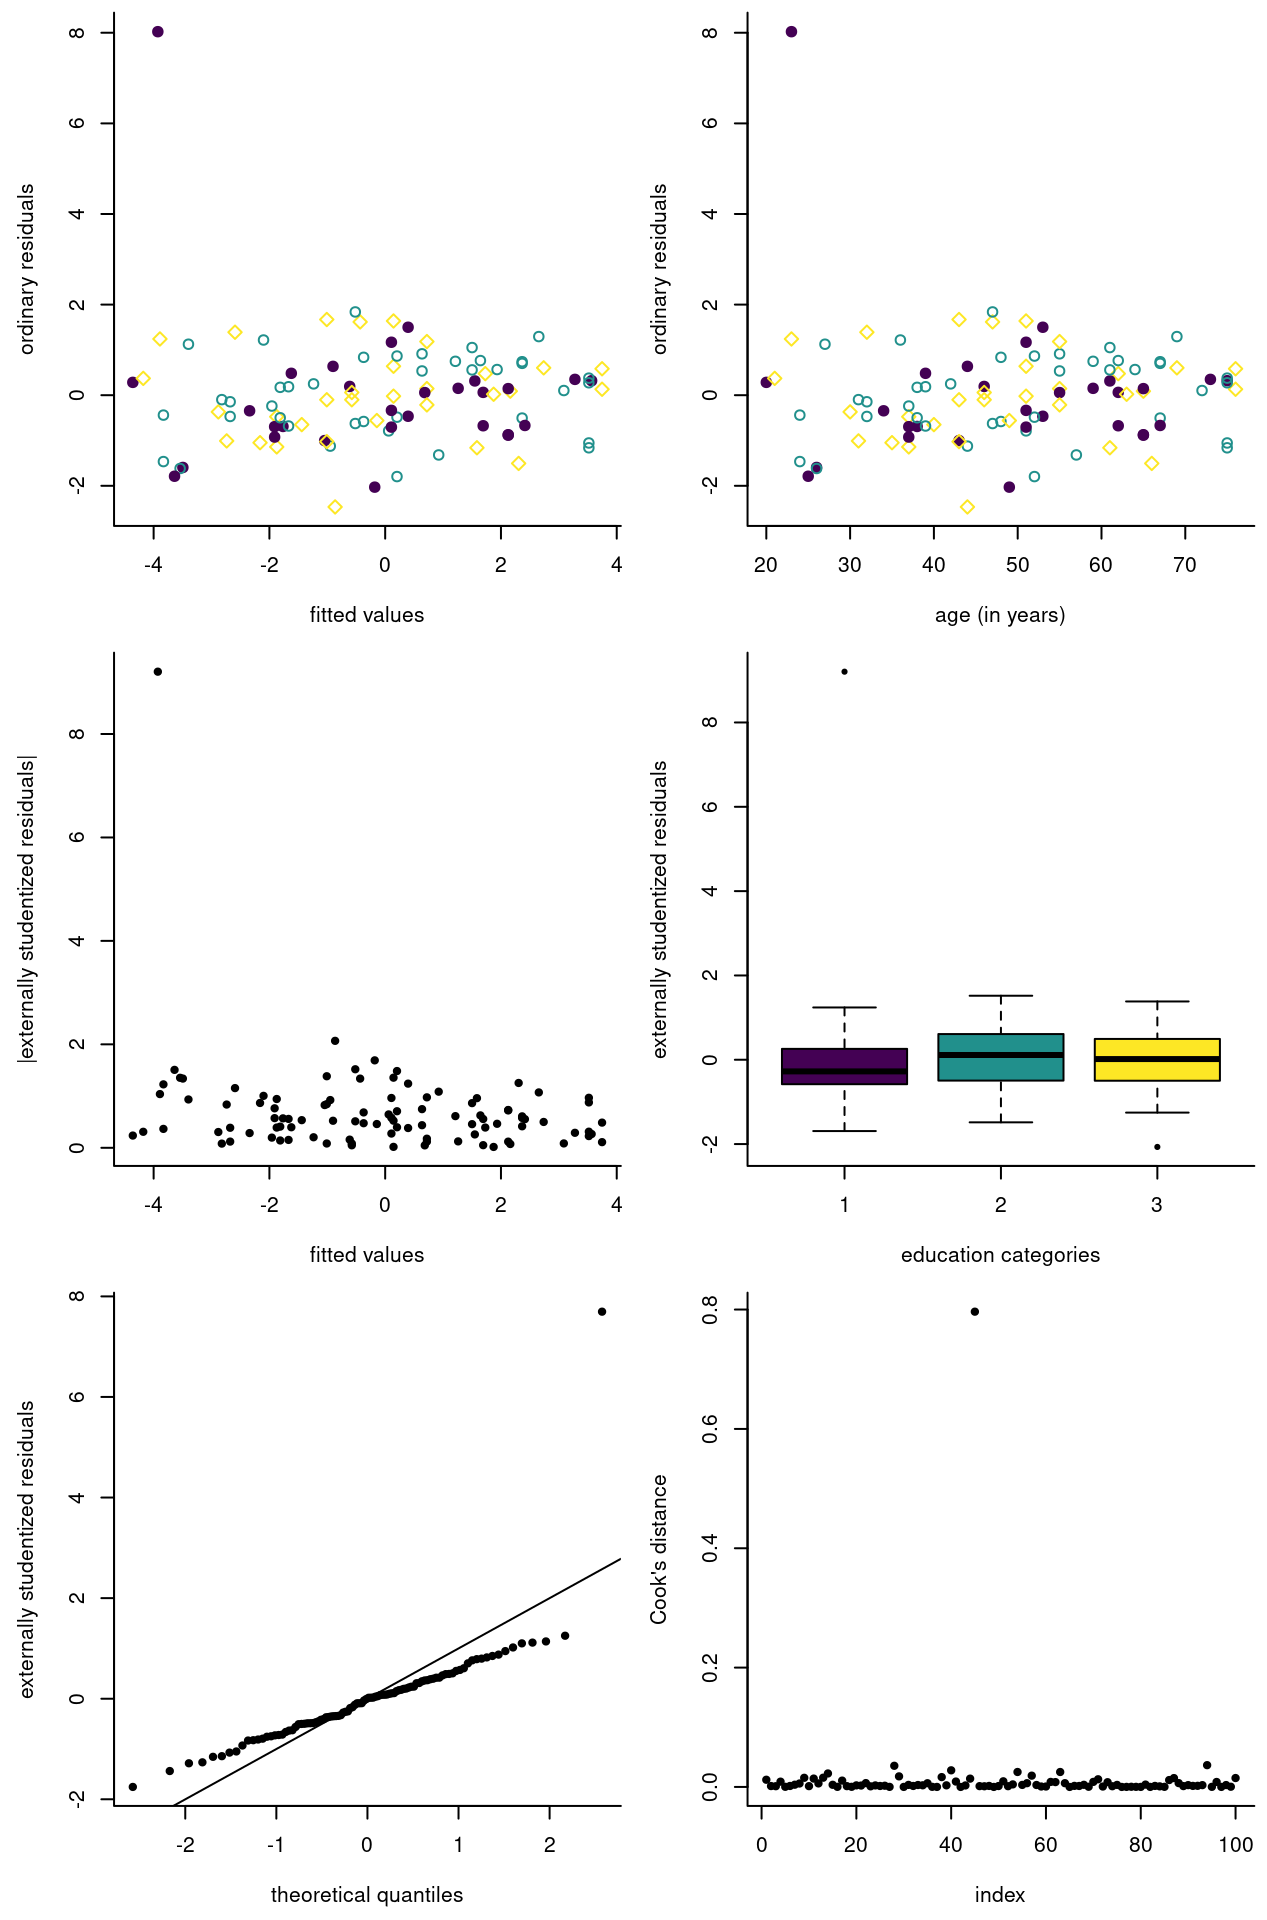
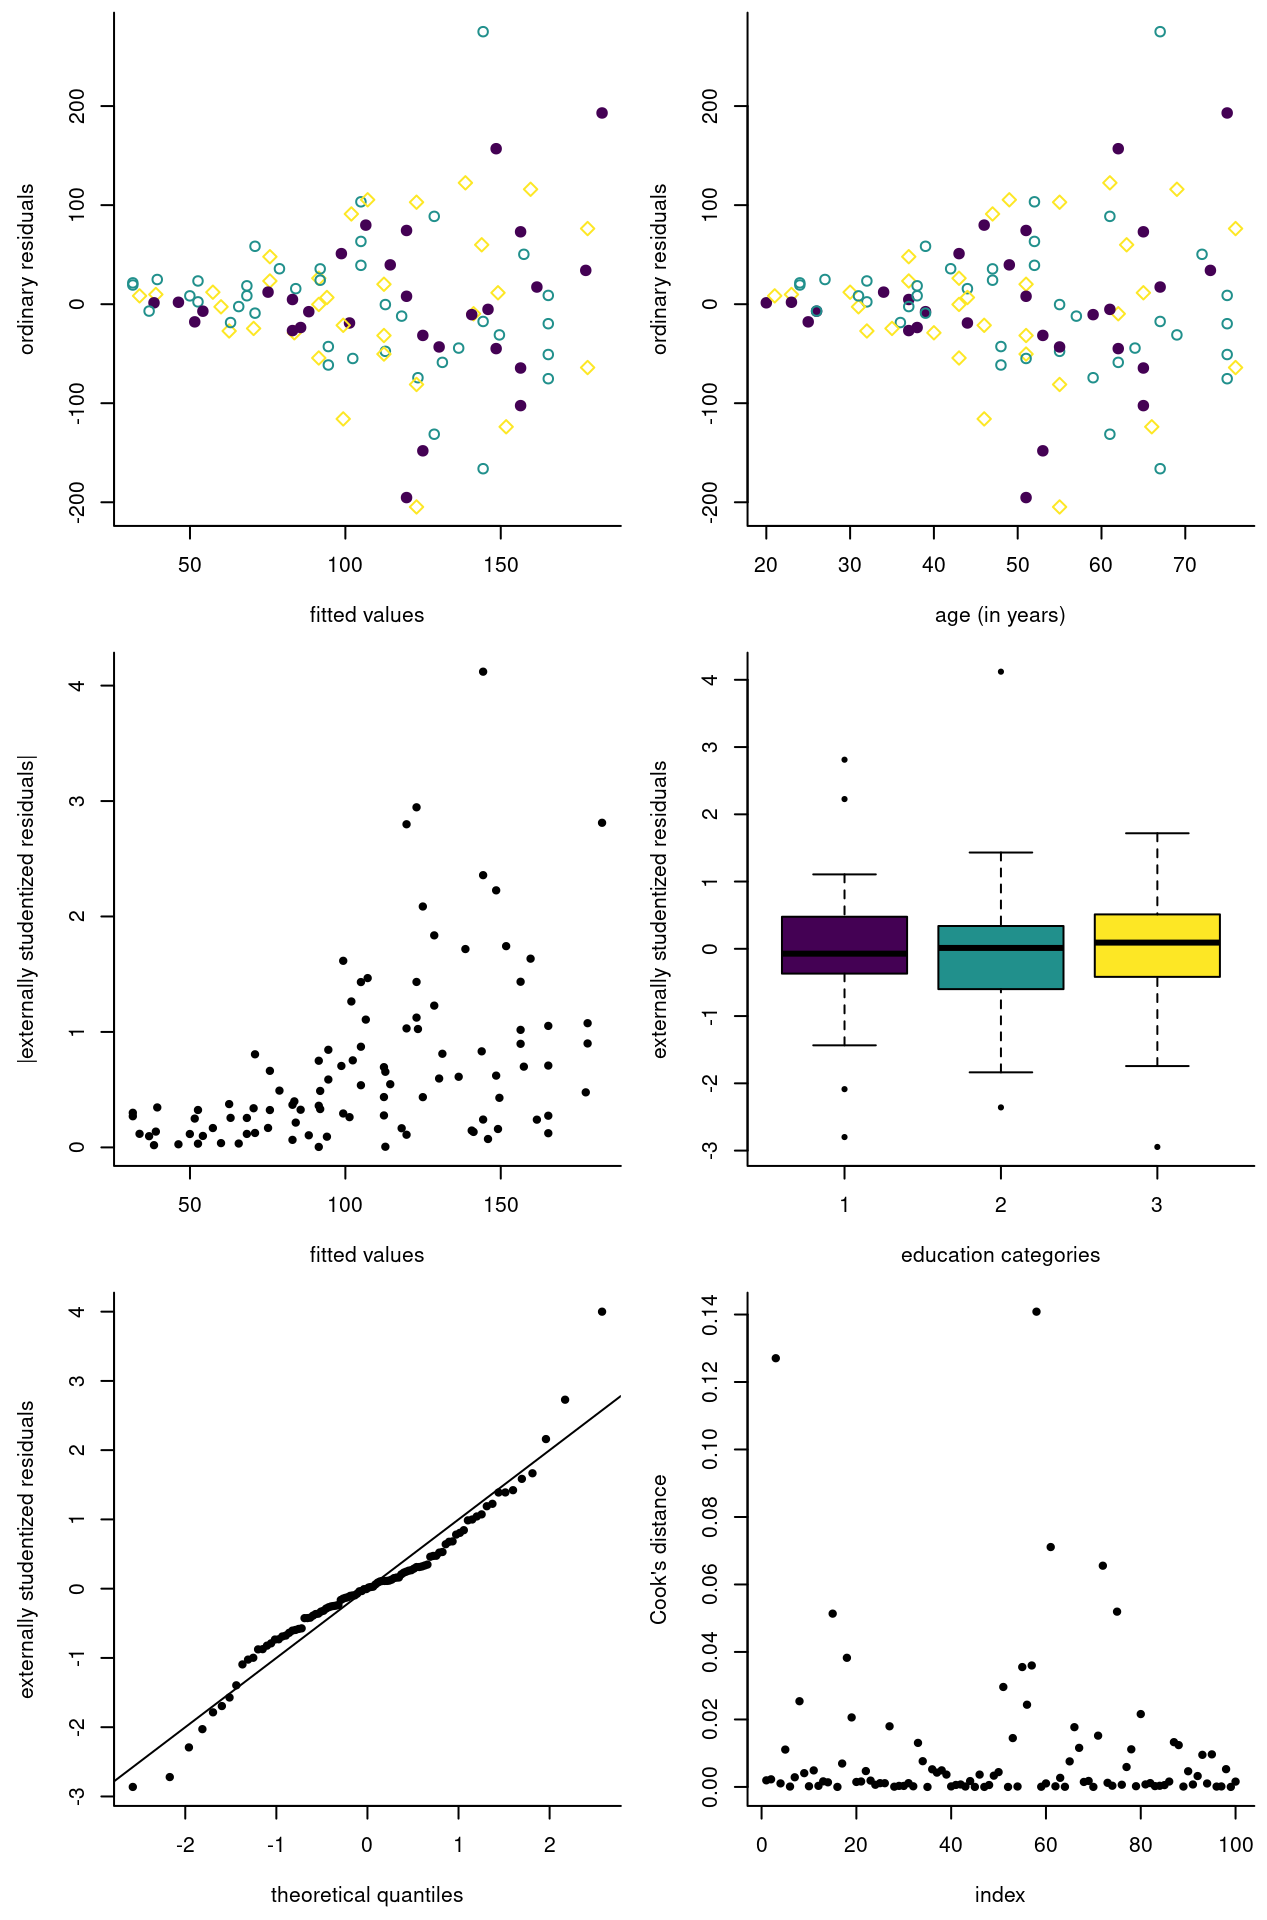
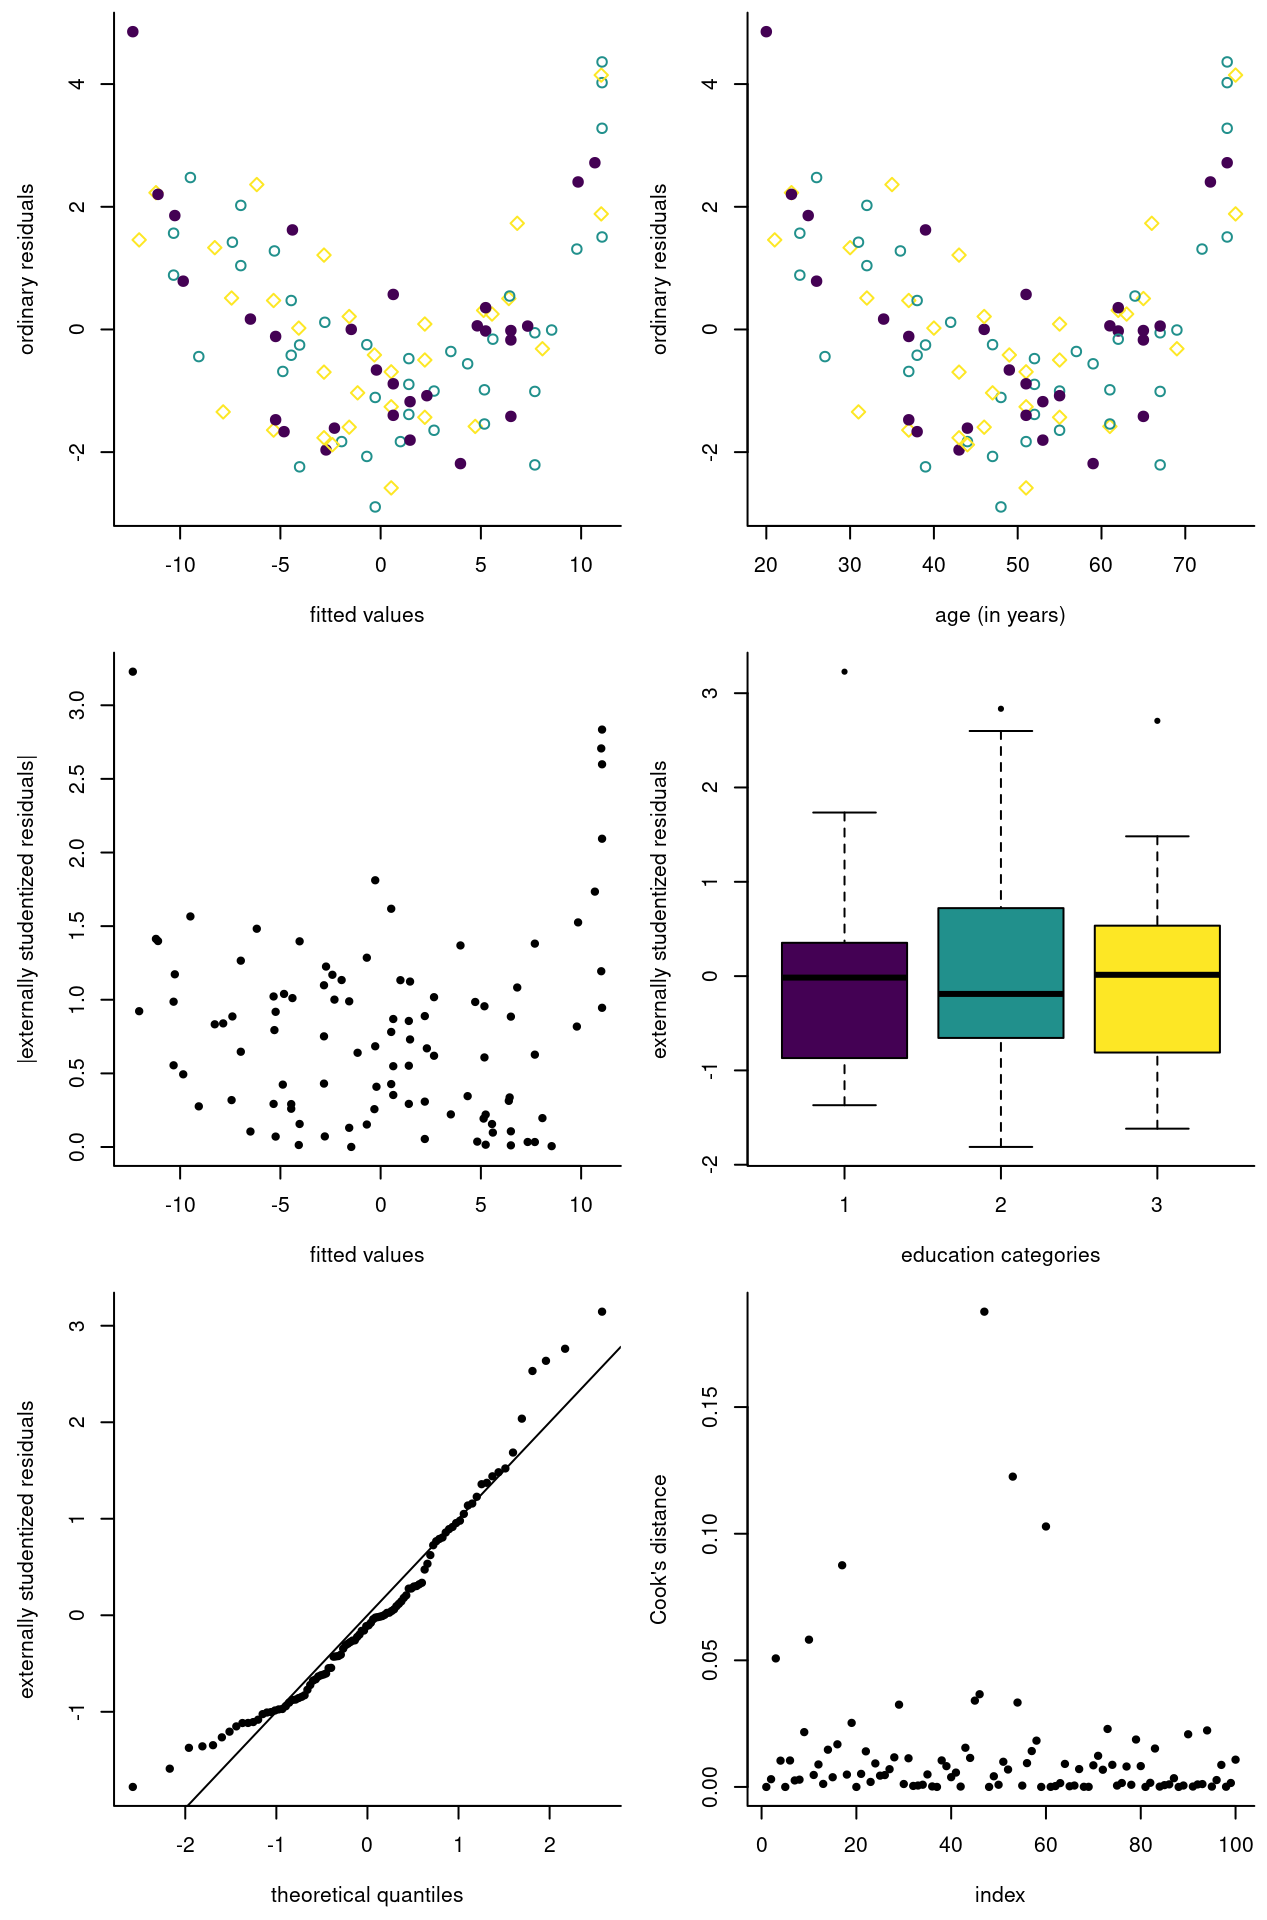
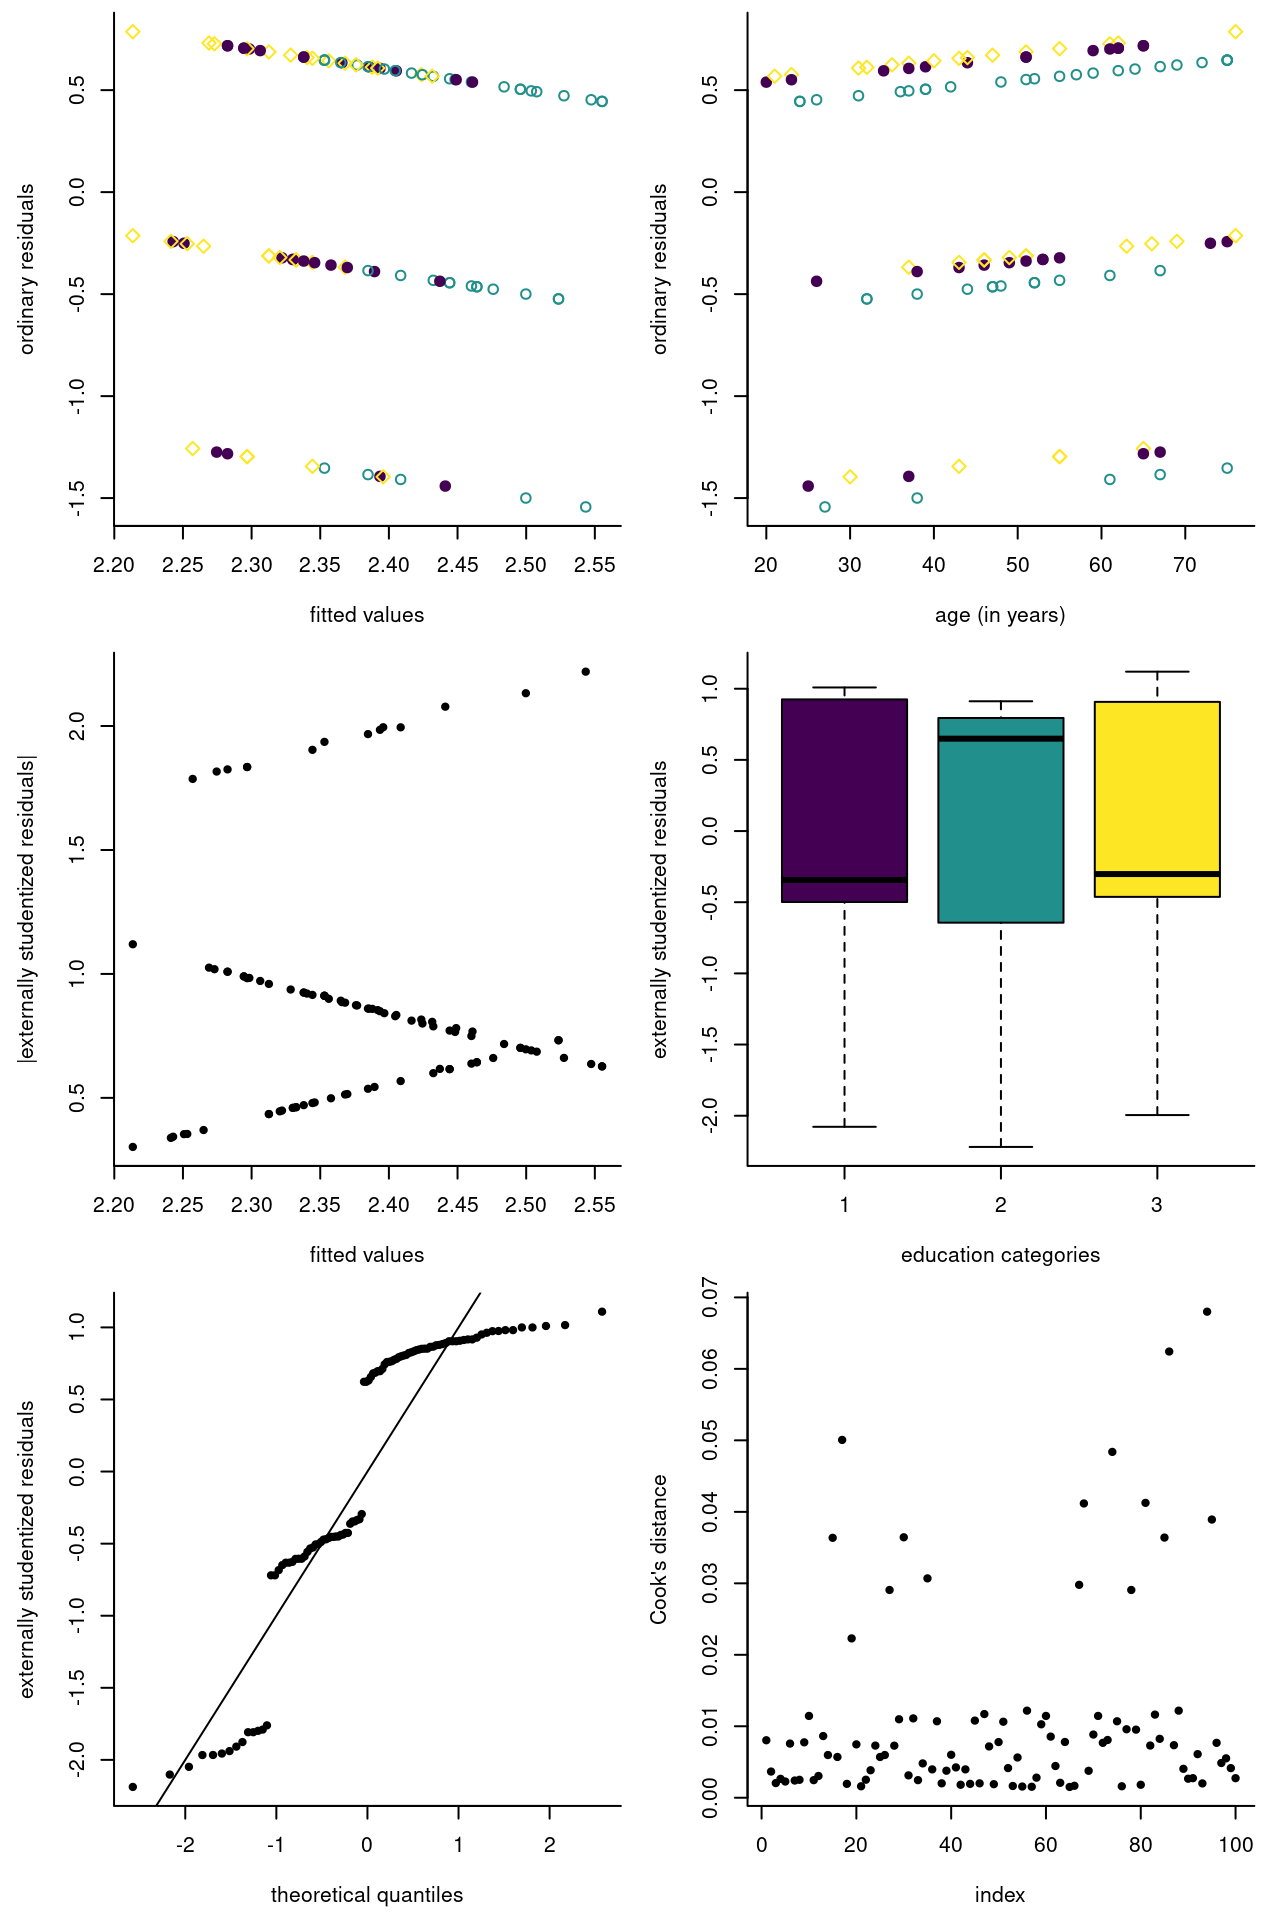
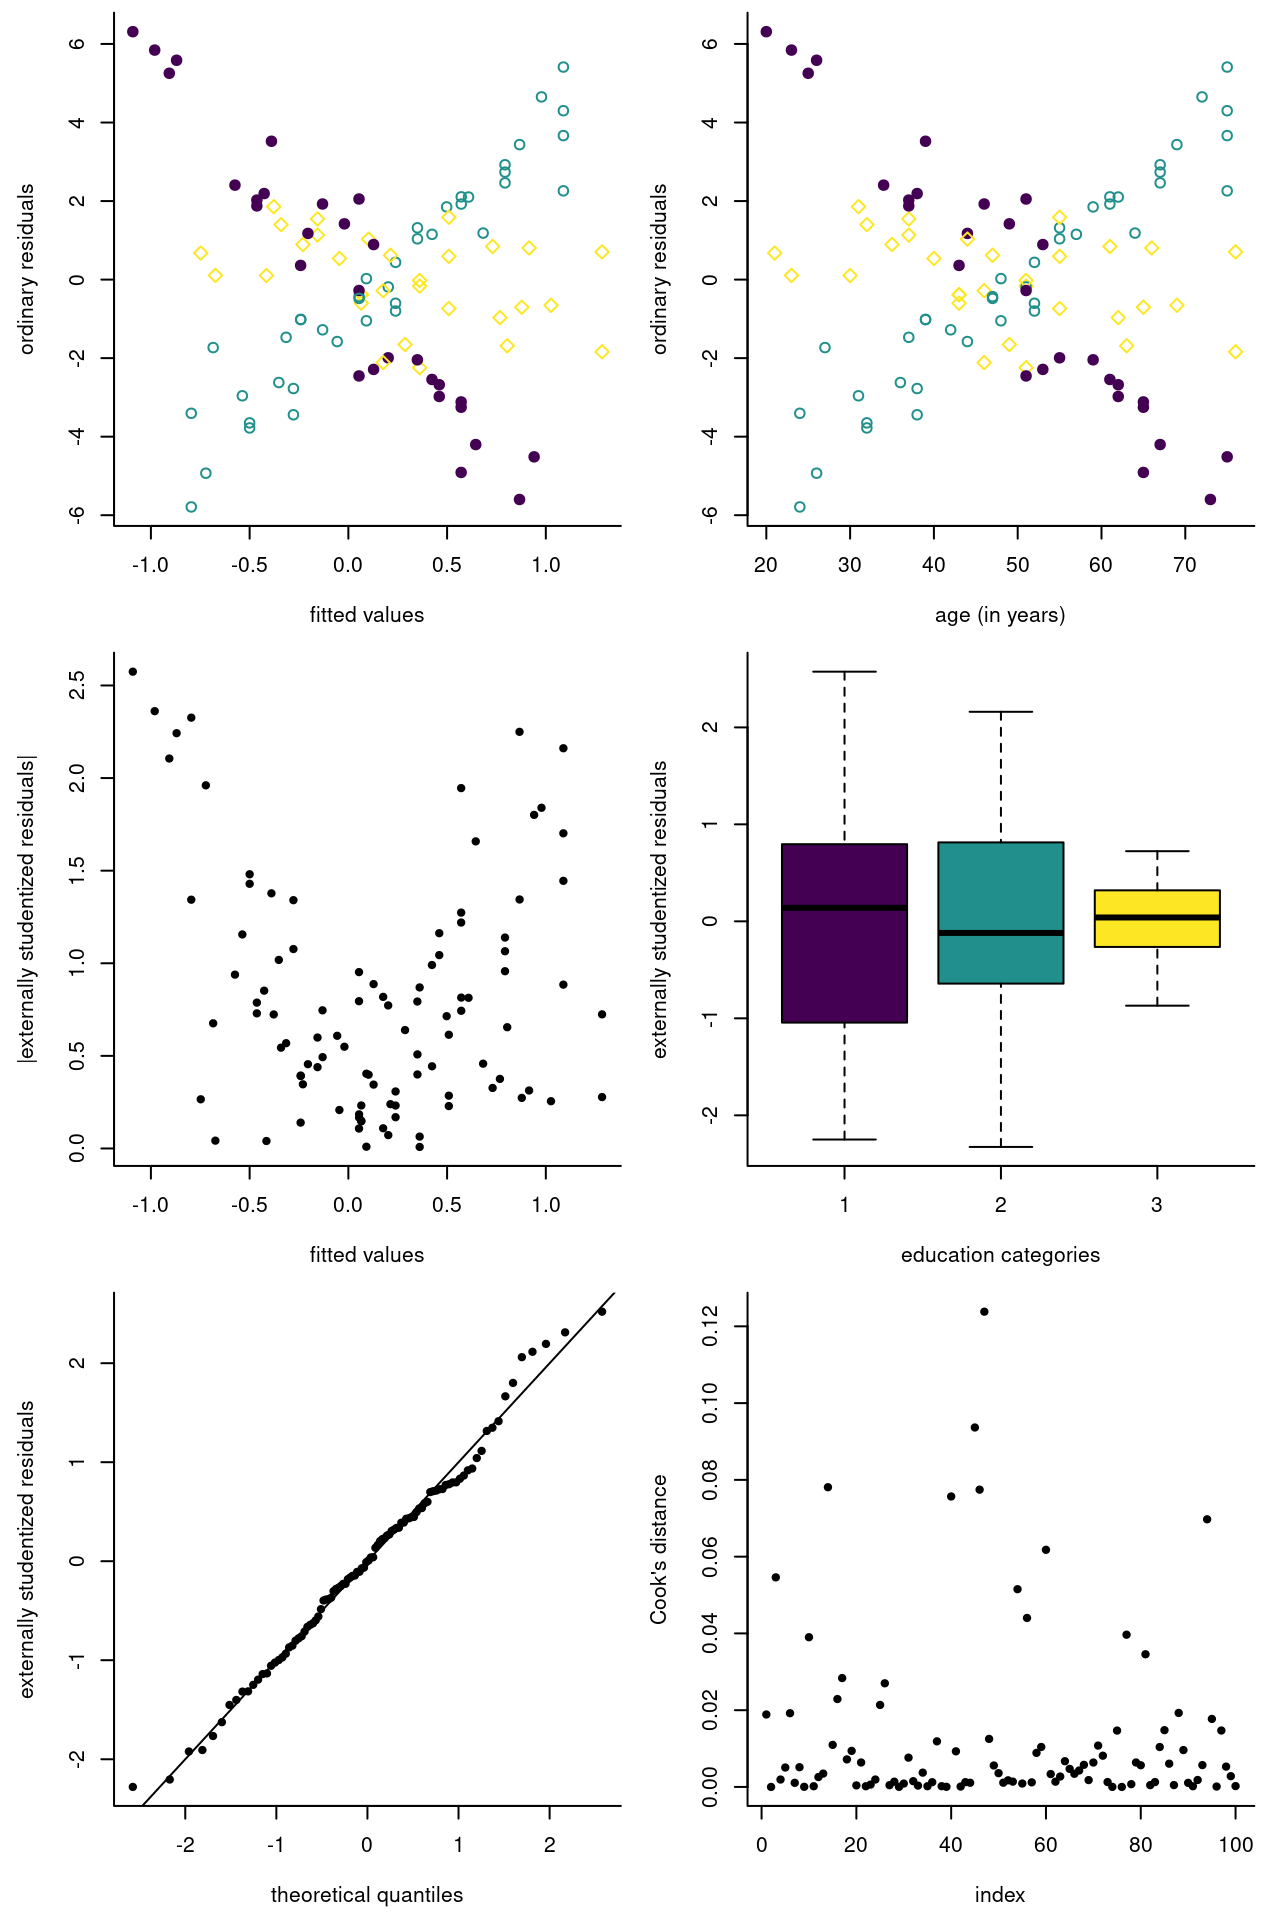
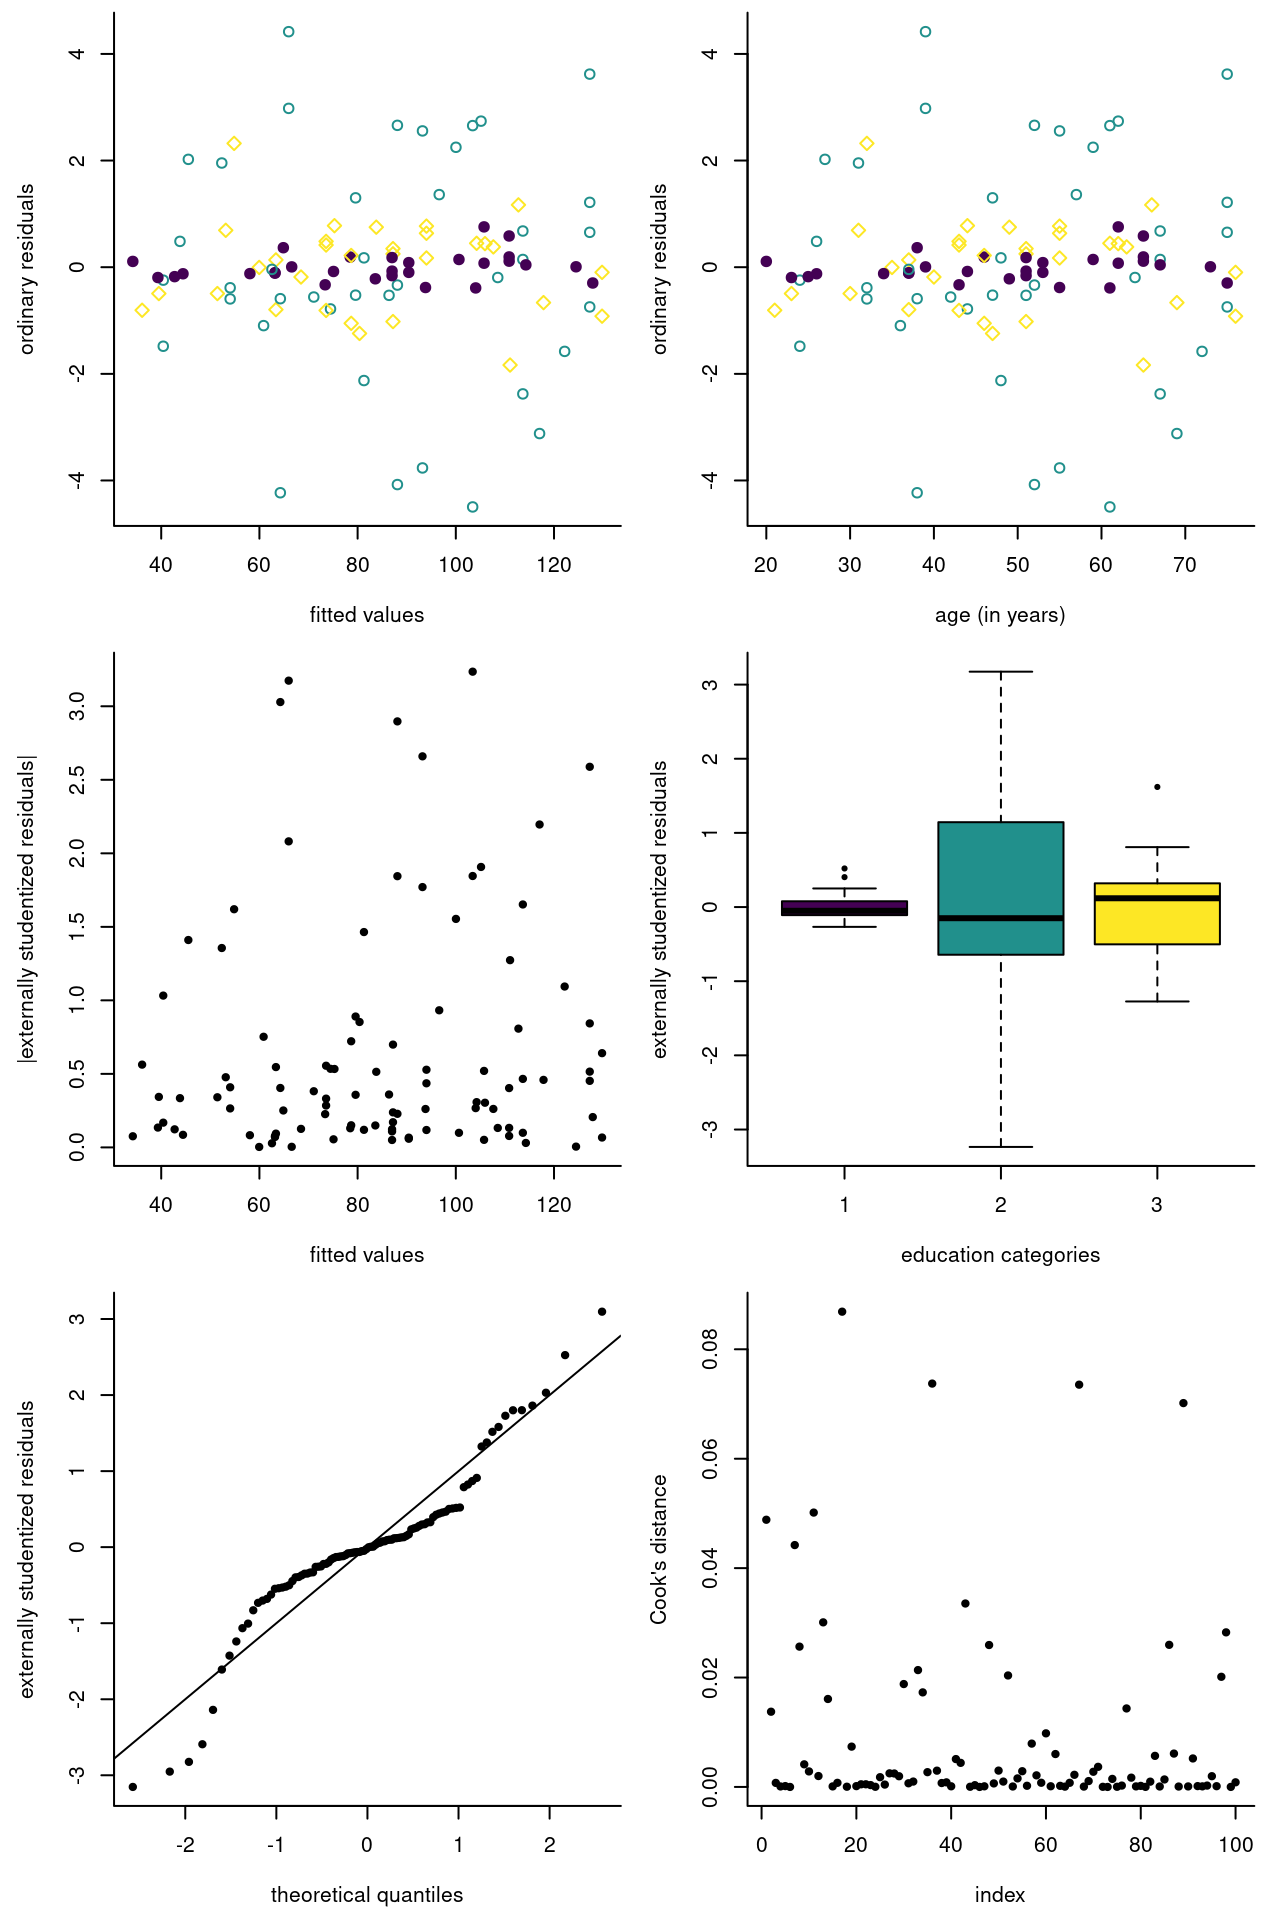
The diagnostic plots are: plot of ordinary residuals versus fitted values (top left), plot of ordinary residuals against explanatory variable age (top right), plot of the absolute value of the externally studentized residuals against fitted values (middle left), plot of the externally studentized residuals against education level (middle right), quantile-quantile plot of the externally studentized residuals (bottom left) and Cook’s distance plot as a function of the variable index (bottom right).
Careful: some violations have feedback on multiple graphs.
Model assumptions
- independence
- incorrect mean model specification
- additivity
- homoscedasticity
- normality
- absence of outliers
Example 1
Example 2
Example 3
Example 4
Example 5
Example 6