6.3 Diagnostics for missing values and smoothing
The package stlplus handles missing values, contrary to stl. Likewise, there are utilities in zoo to perform linear interpolation or use smoothing estimates from a seasonal Kalman filter (which we will cover at the end of the course).
These are available respectively under the name zoo::na.approx and zoo::na.StrucTS (see also the help file). More sophisticated methods can be found in the package imputeTS. The latter provides more tools for plotting data with missing values (plotNA.distribution) and obtaining summary statistics out of the box (statsNA).
library(imputeTS)
plotNA.distribution(tsAirgap)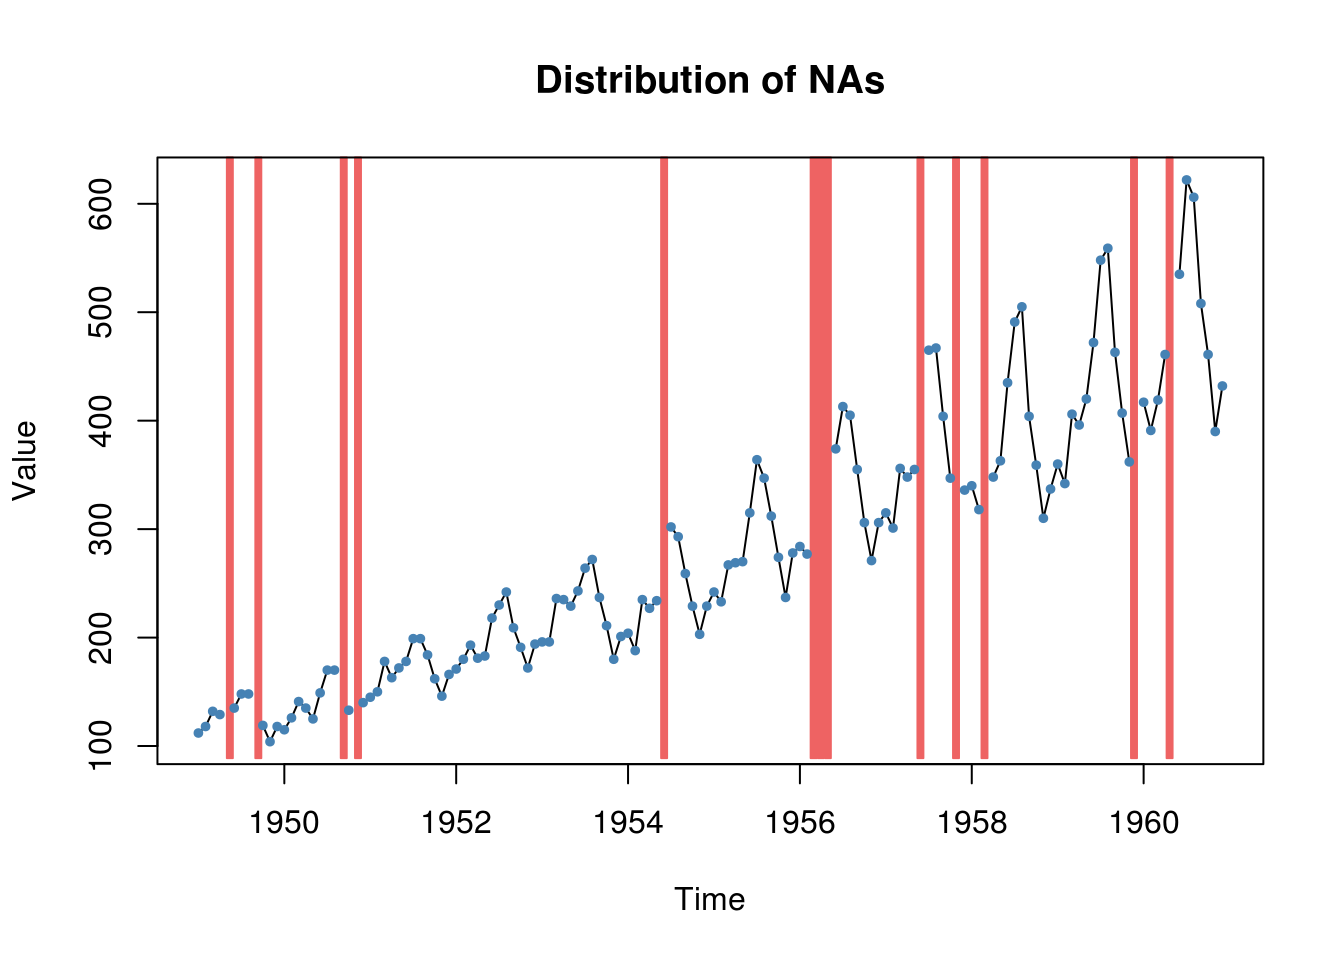
plotNA.imputations(x.withNA = tsAirgap, x.withImputations = na.seadec(tsAirgap,
    "kalman"), x.withTruth = tsAirgapComplete)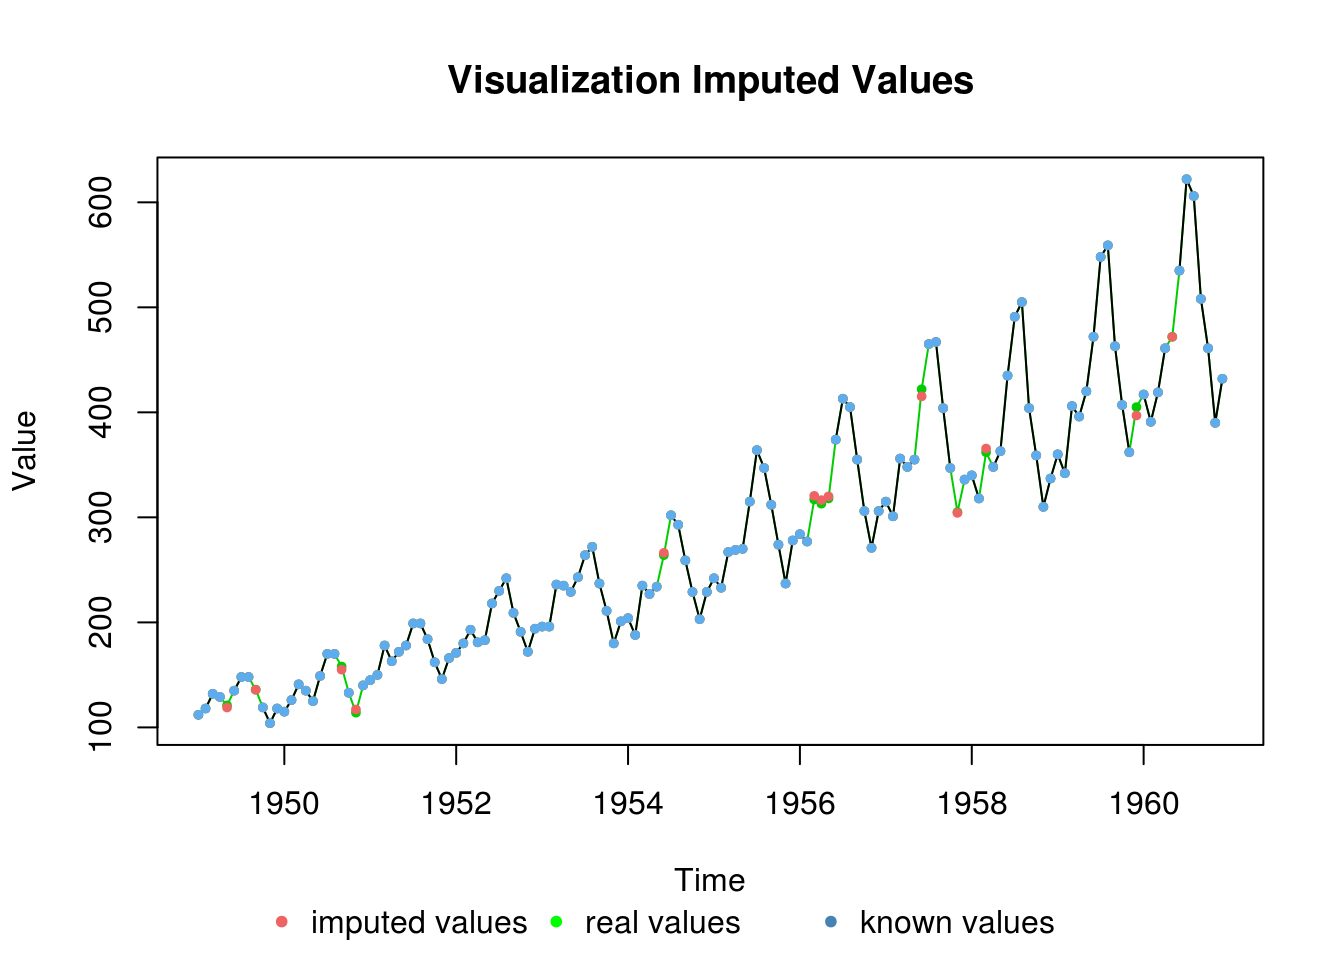
# Install package if not already present, otherwise load it
if (suppressWarnings(!require(stlplus))) {
    install.packages("stlplus")
    library(stlplus)
}

plot(stl_Airgap <- stlplus(tsAirgap, s.window = "periodic"))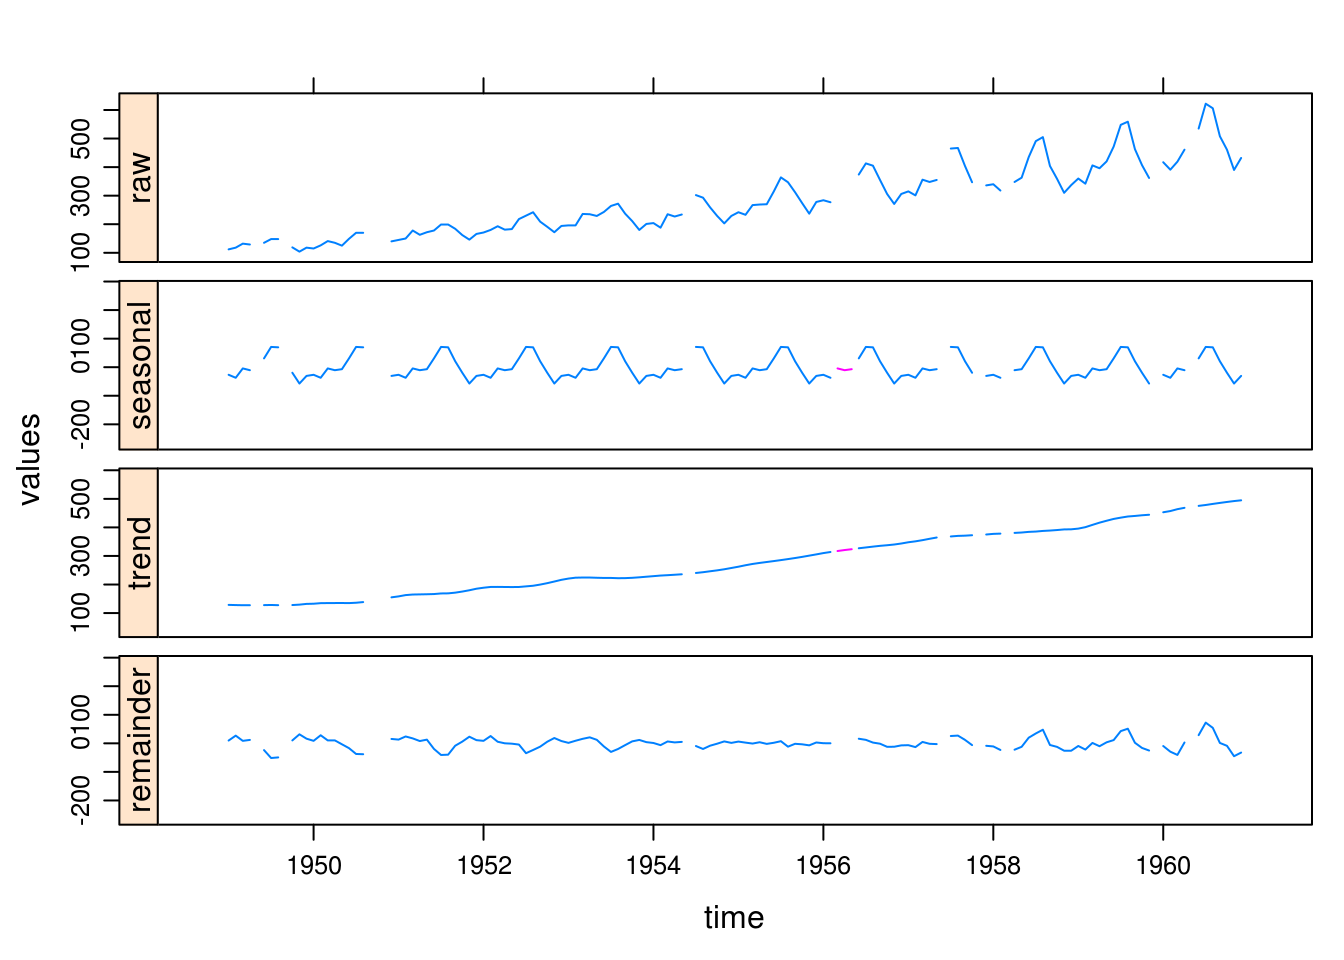
# Increasing variance with number of air passengers - would need to
# transform the series to stabilize the variance
The following illustrates the use of local fit to interpolate the missing values, but one could equally well fit using a local linear model with loess and use the fitted values by predicting at unobserved time points. In general, these predictions are wrong because they do not include any time dependence structure. Another useful feature from the package zoo is na.trim to removing trailing NAs at the beginning and the end of a series.
6.3.1 Exercise 2: Tyne river flow
- Import the following dataset and look at the summary
tyne <- read.csv(file = "http://sma.epfl.ch/~lbelzile/math342/23001-Tyne_at_Bywell.csv",
    header = FALSE, sep = ",", skip = 16, col.names = c("time", "height", "flag"),
as.is = TRUE, na.strings = "NA")[, 1:2]- The dataset contains missing values. Transform
tyneinto an object of classts. Plot the series withplotNA.distribution. Comment on the implications of imputing those values and on the values of the (partial) correlogram. - Try using
zoo::na.locf. What does the function do? - Perform an
stldecomposition withstlplusand comment on the output.