1.1 Exploratory Data Analysis
1.1.1 Libraries
We will use many functions from the base package, which is loaded by default, but also some functions from time series libraries. What makes the R programming language so great is its vast contributed packages libraries. An exhaustive list of these can be found at https://cran.r-project.org/web/views/TimeSeries.html. Let’s install some of these.
# Most common time series libraries
install.packages(c("dlm", "forecast", "lubridate", "tsa", "tseries", "xts",
    "zoo"), dependencies = TRUE)
# Datasets
install.packages(c("expsmooth", "fpp", "TSA", "astsa"))
# Hadley Wickham's tidyverse universe
install.packages("tidyverse")

# To load a library, use the function
library(xts)
As a side remark, note that the tidyverse, which loads a bundle of packages, overwrites some of the base functions, notably lag and filter which are present in both dplyr and stats (one of the default libraries that come alongside with R and is loaded upon start). Load libraries with great caution! In case of ambiguity (when many functions in different packages have the same name), use the :: operator to specify the package, e.g. stat::lag. You can unload a library using the command
detach("package:tidyverse", unload = TRUE)1.1.2 Loading datasets
You can load and read objects, whether txt, csv from your computer or by directly downloading them into R from the web. You can call R datasets found in packages via data()
Good data sources for your semester projects are
1.1.3 Time series objects and basic plots
Objects in R are vectors by default, which have a type and attributes (vector is a type, length is an attribute of vectors). Some objects also inherit a class, such as ts. They inherit printing and plotting methods specific to the data class.
We start by loading the AirPassengers dataset, which contains monthly airline passenger numbers for years 1949-1960. Datasets that are found in libraries other than datasets must typically be loaded via a call to data, unless they are lazy loaded when calling the library. Both datasets are time series.
# AirPassenger dataset, lazy-loaded
class(AirPassengers)  #object of class 'ts'
[1] "ts"`?`(AirPassengers #description of the dataset
)
# Basic plot
plot(AirPassengers, ylab = "Monthly total (in thousands)", main = "Number of international airline passengers")
grid()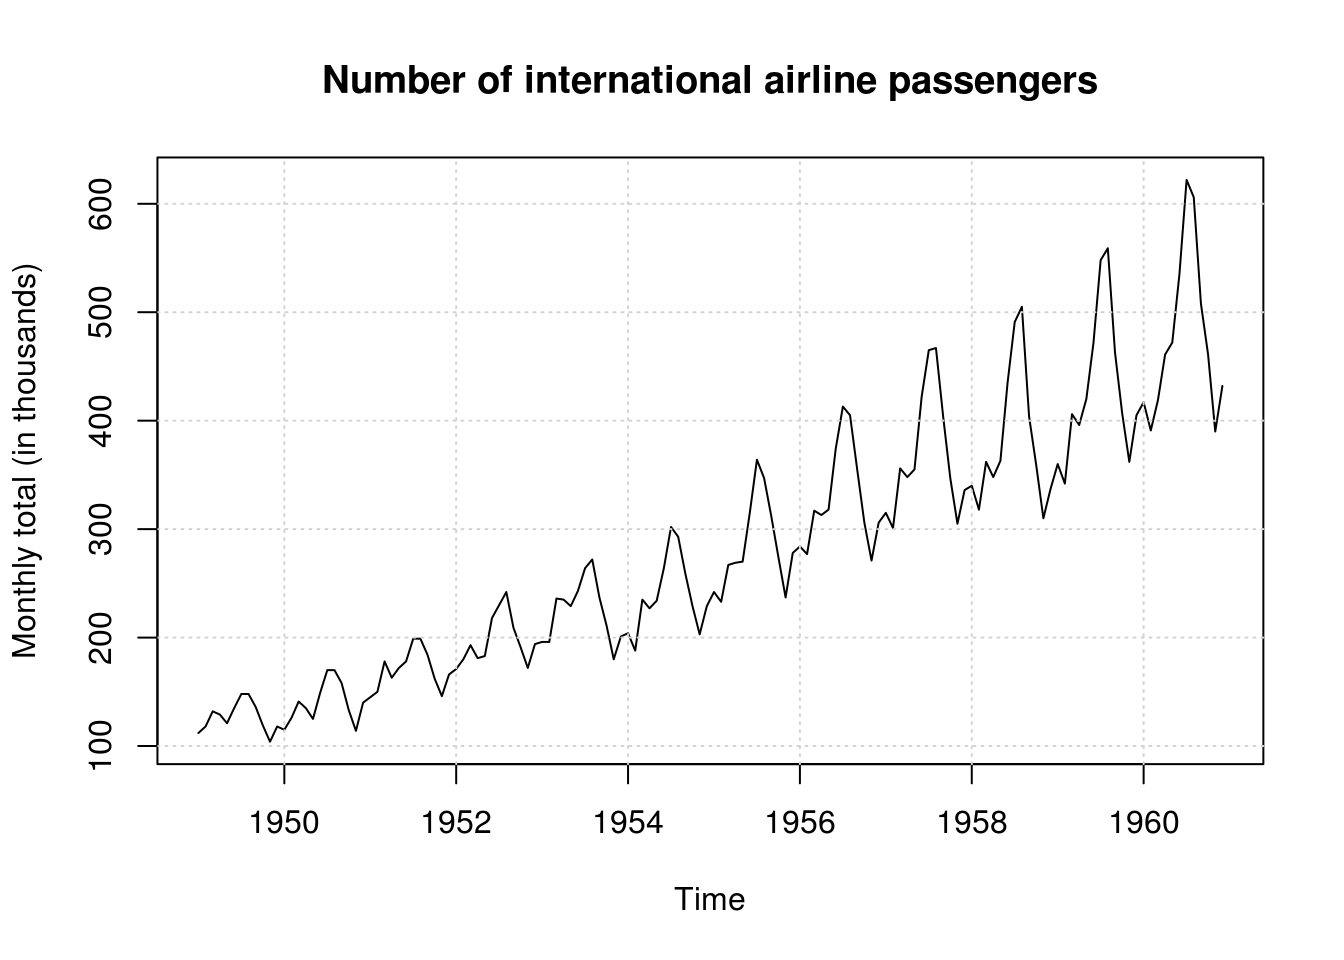
`?`(sunspot.month)
plot(sunspot.month, ylab = "Monthly number of sunspots", main = "Monthly mean relative sunspot numbers from 1749 to 1983",
    bty = "l")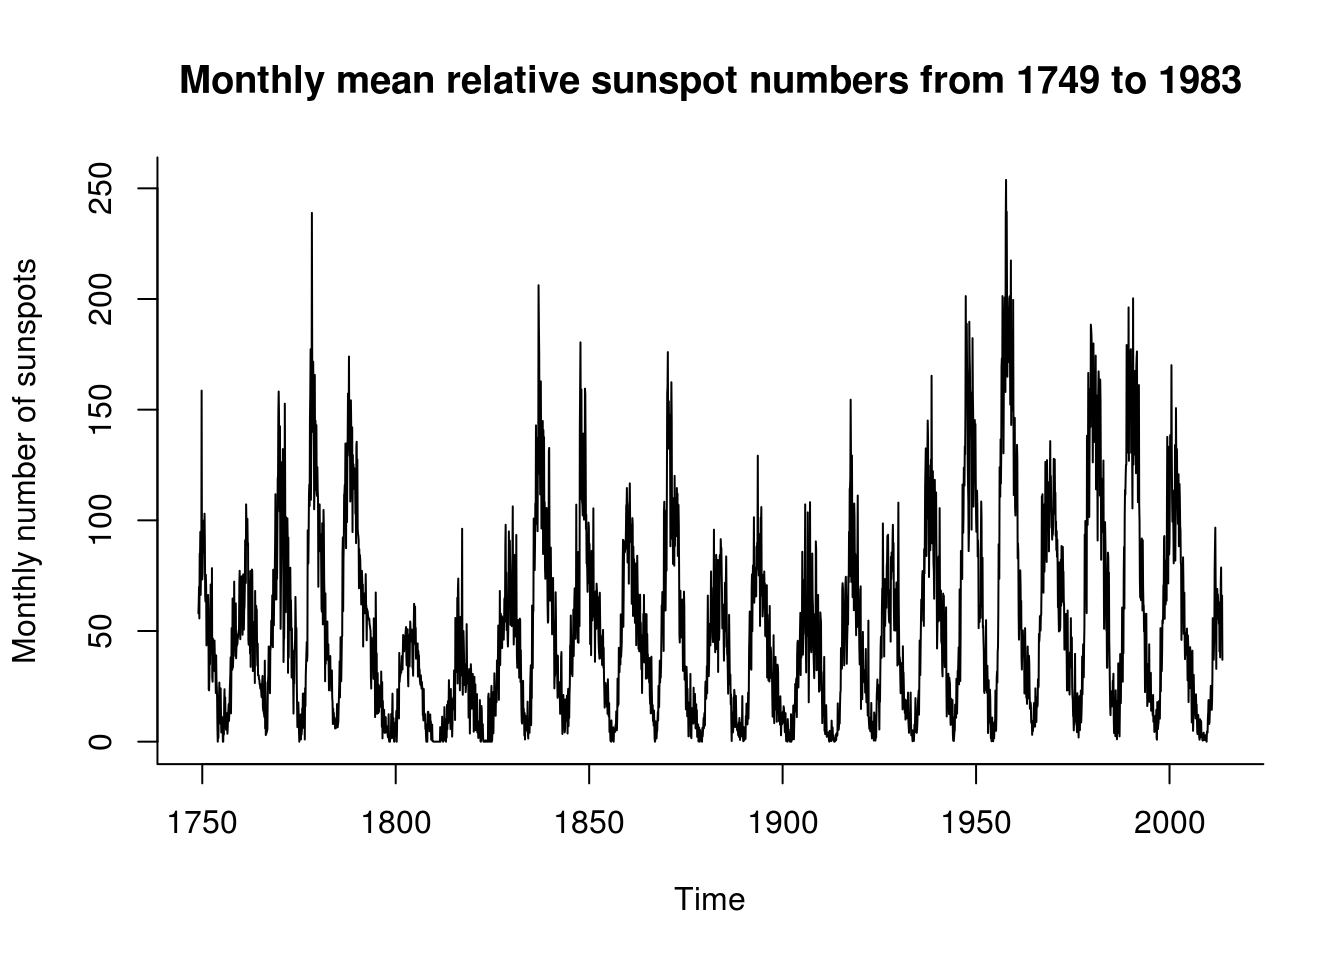
# Dataset present in a R package - without loading the package
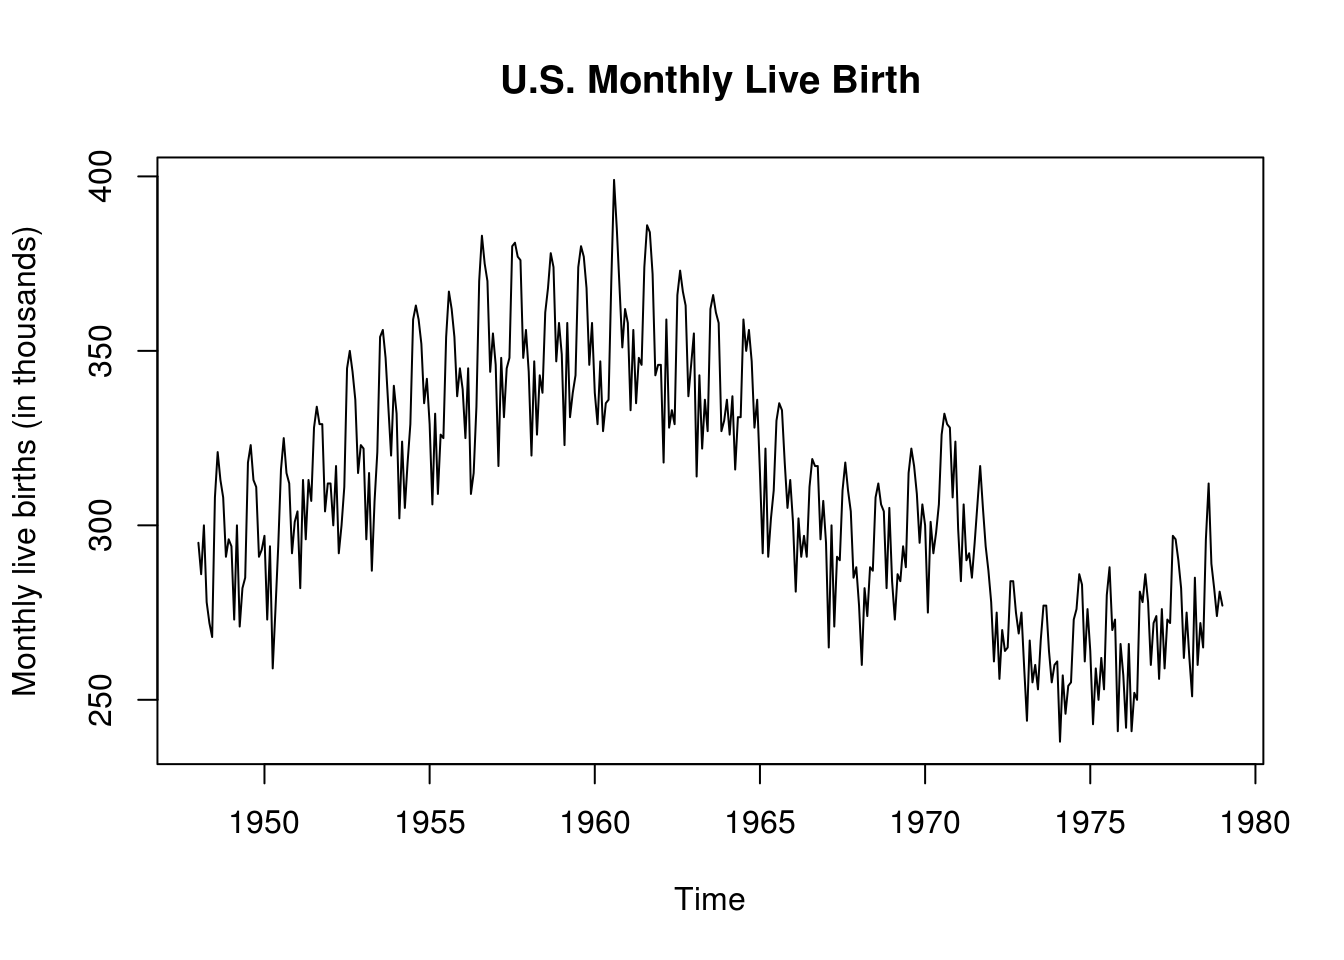
data(list = "birth", package = "astsa")
plot(birth, ylab = "Monthly live births (in thousands)", main = "U.S. Monthly Live Birth")